Upfinzo Insights Dashboard
A data-driven dashboard designed to transform complex customer feedback and operational metrics into clear, actionable insights. Built with a focus on usability, visual hierarchy, and decision-making efficiency in a dark-mode environment.
Quick Preview
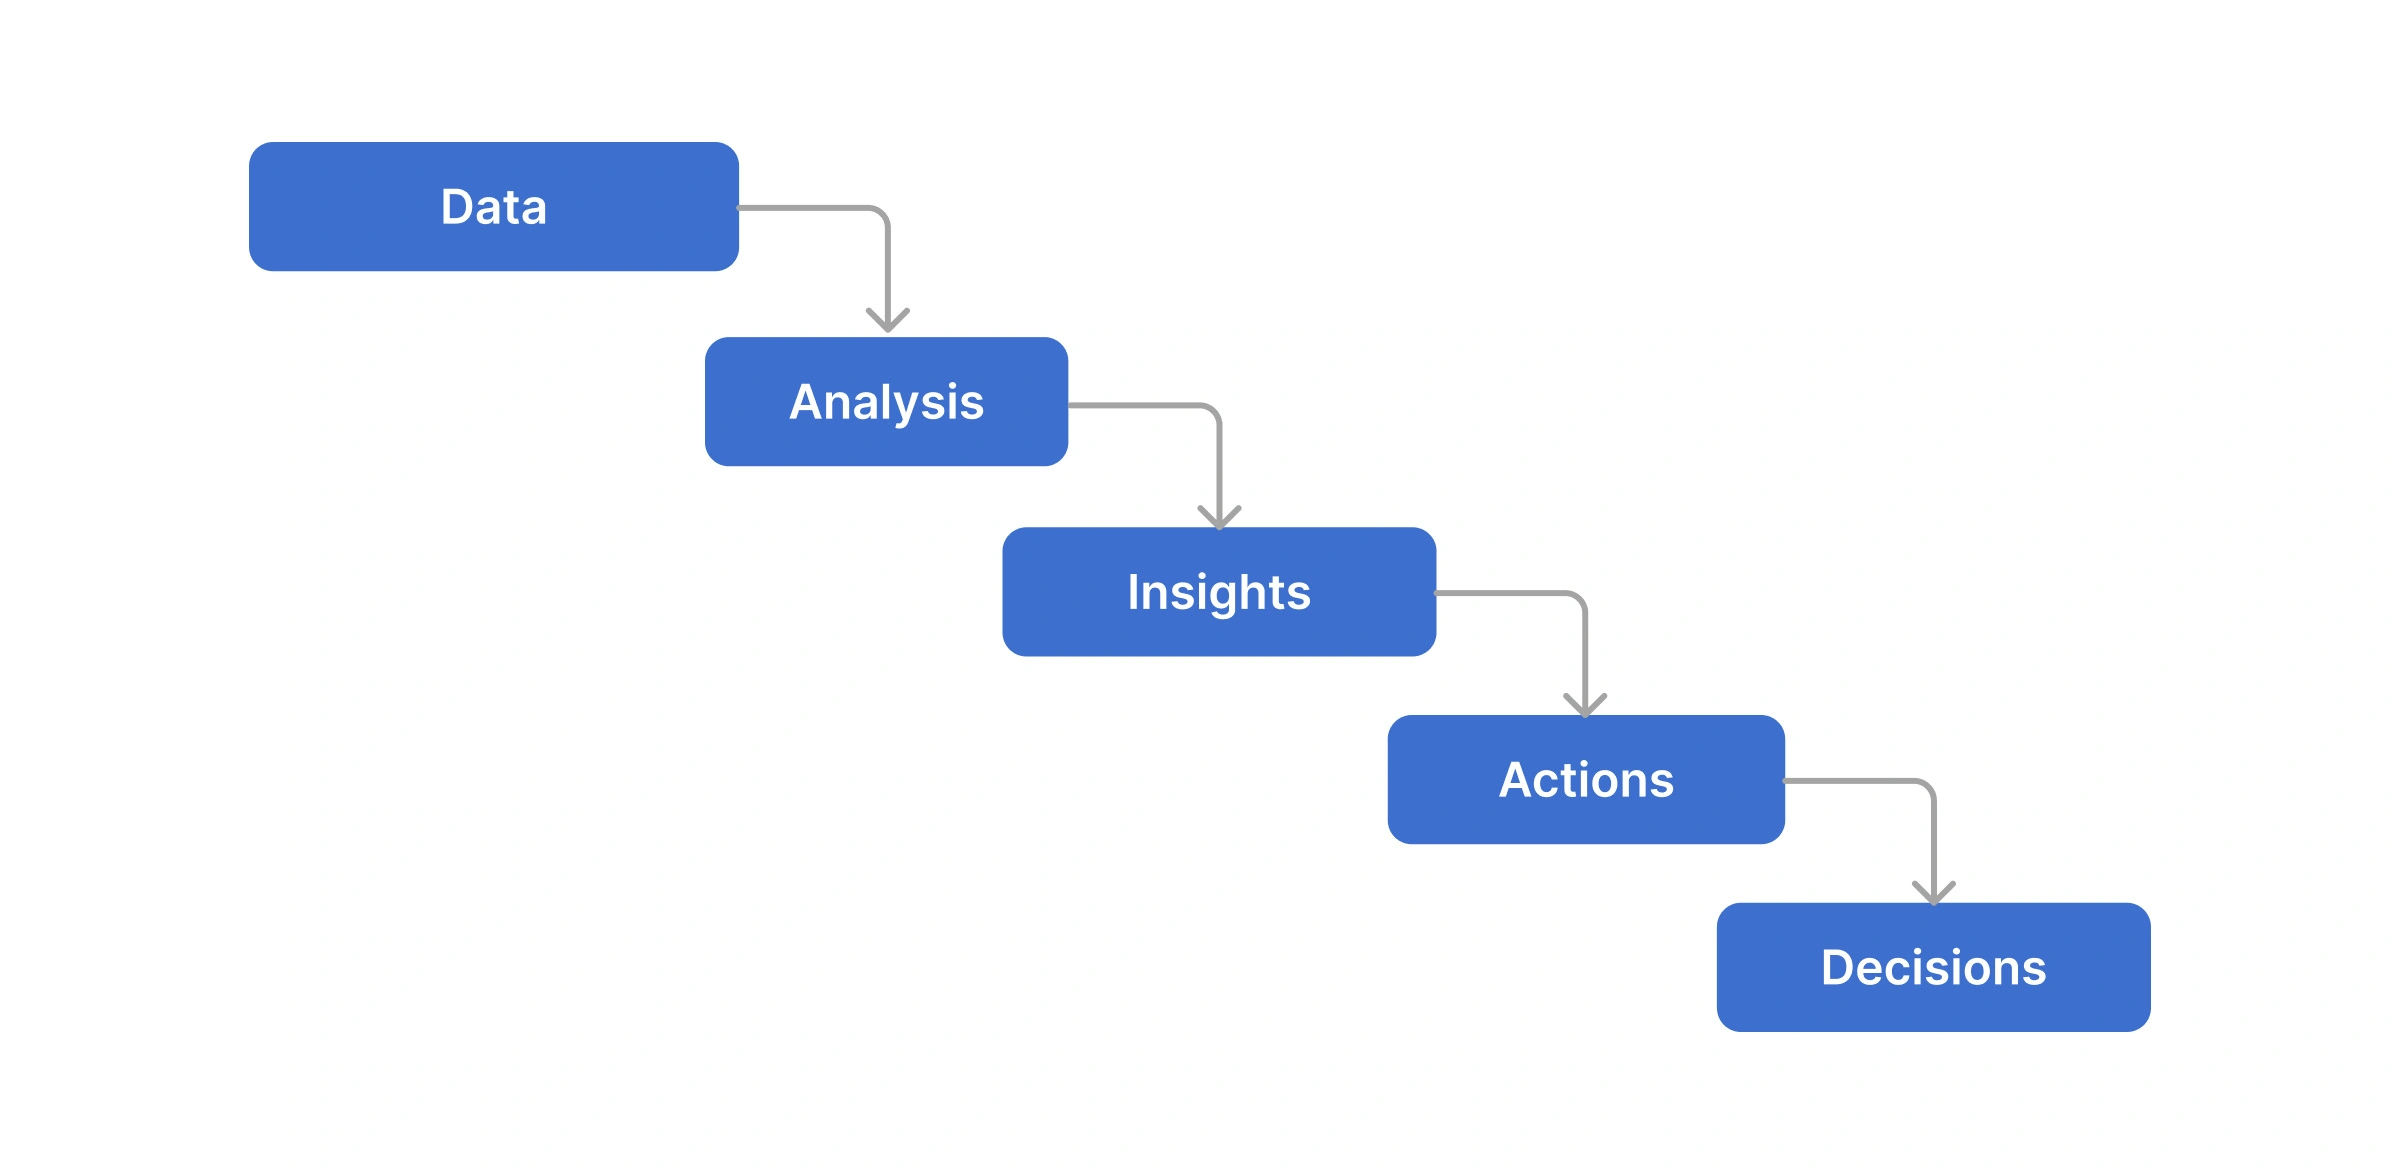
Flow
Why this App?
Turns raw feedback data into actionable insights
Helps identify trends and performance issues quickly
Simplifies complex analytics with clear visualization
Enables faster and better business decisions

Challenges & Solutions
Challenges
Complex Data Overload
Low Visibility of Insights
Difficult Trend Analysis
Poor Decision Support
Solutions
→ Structured information into modular cards and grouped layouts
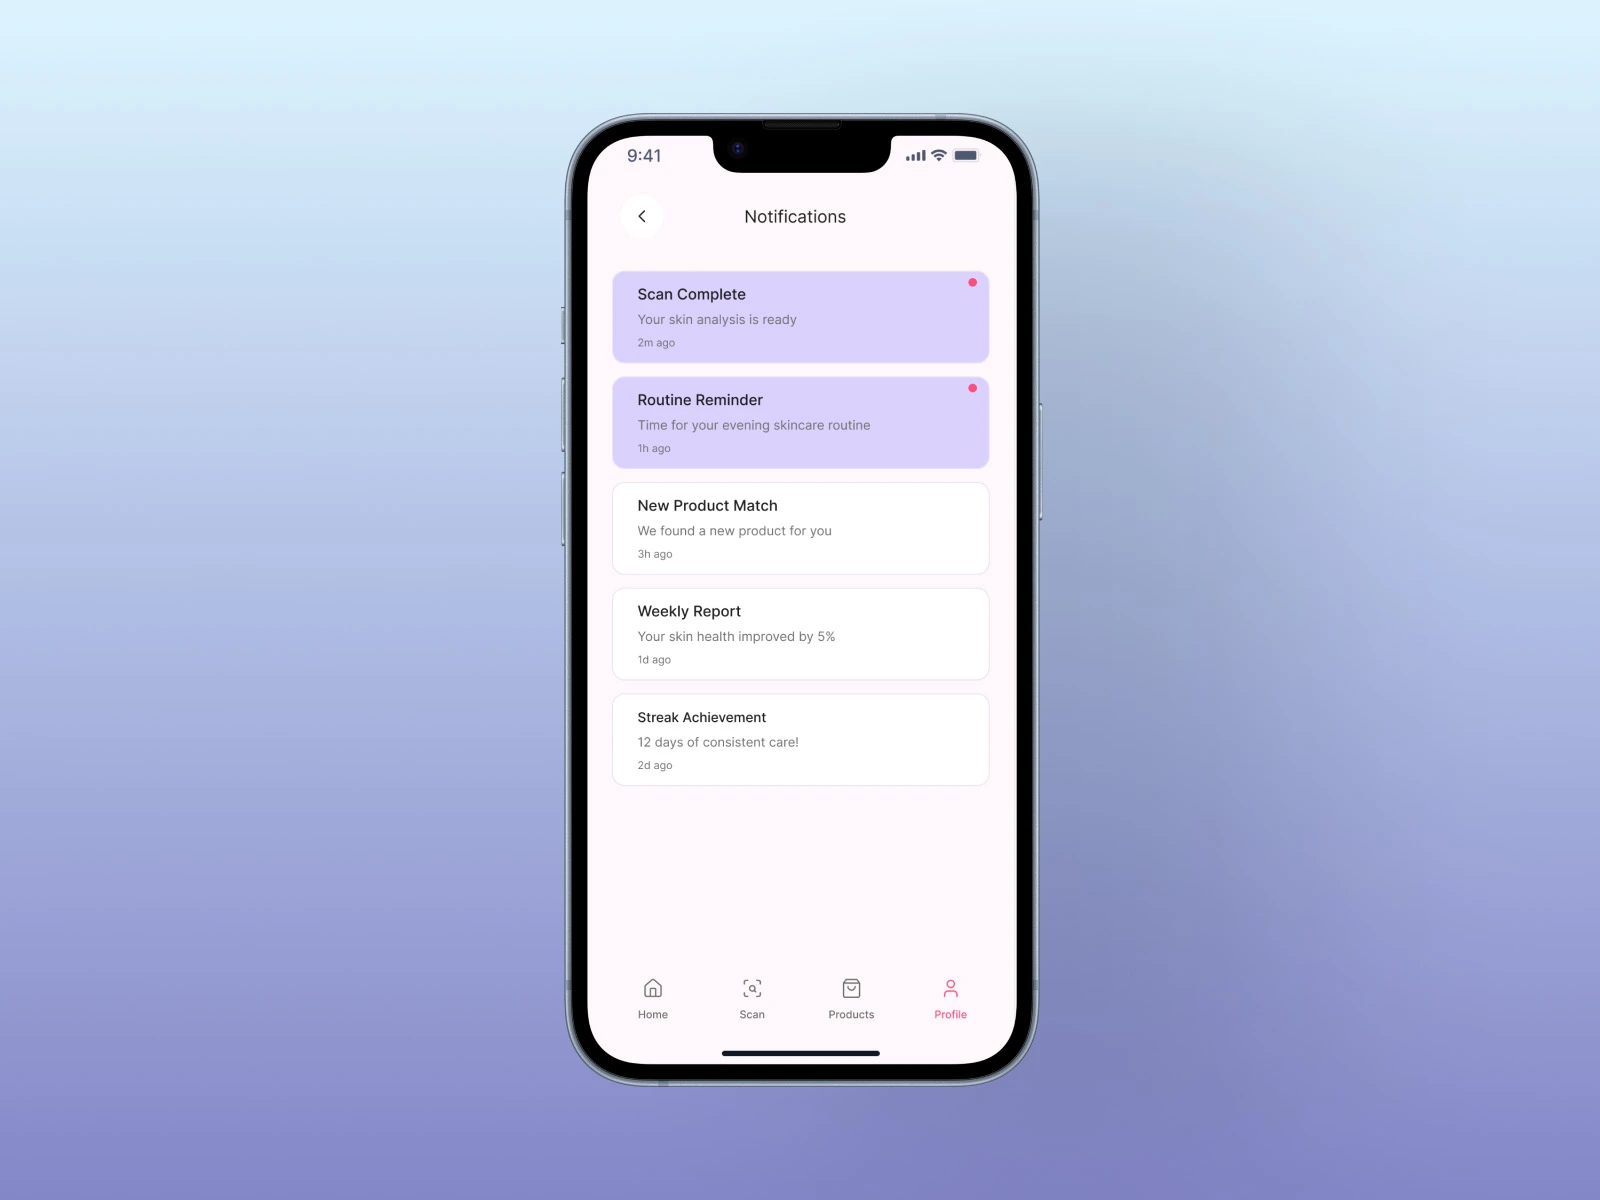
→ Introduced alerts and highlighted key metrics for quick scannings
→ Used charts and visual patterns to make trends easy to understands
→ Added insight-driven sections to guide user actions clearly
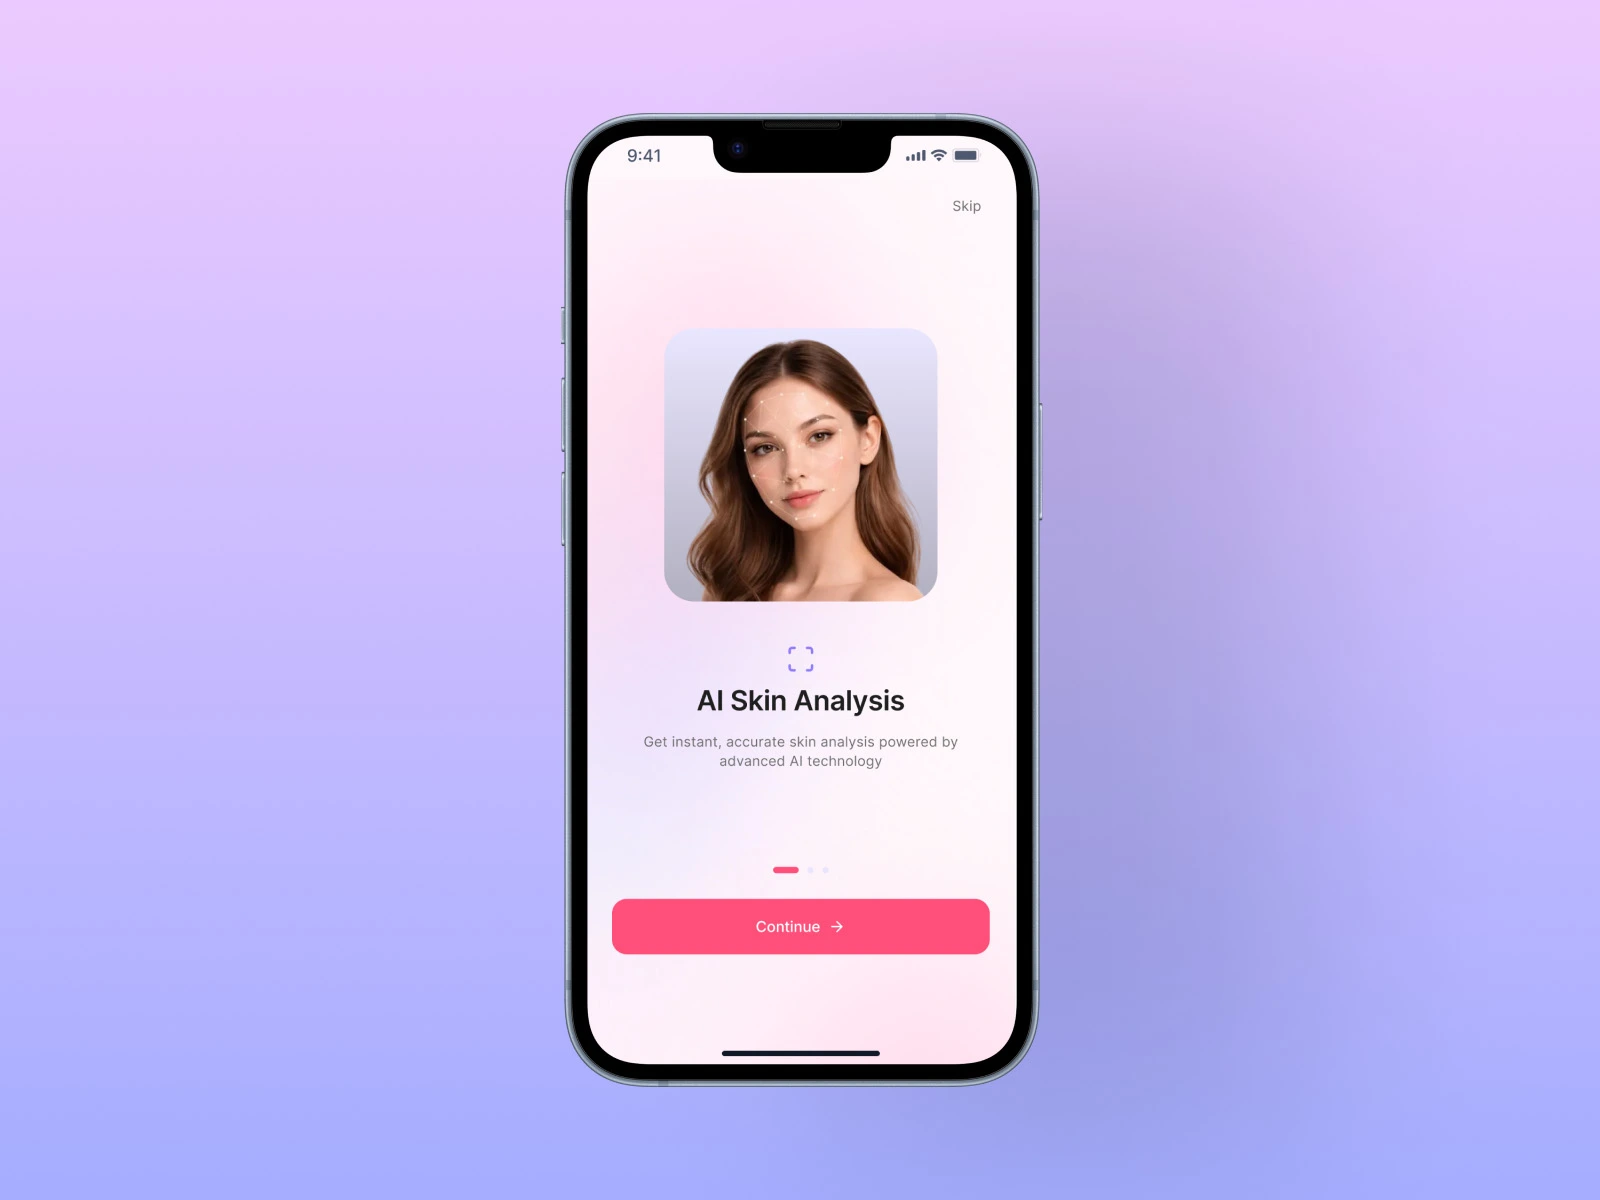
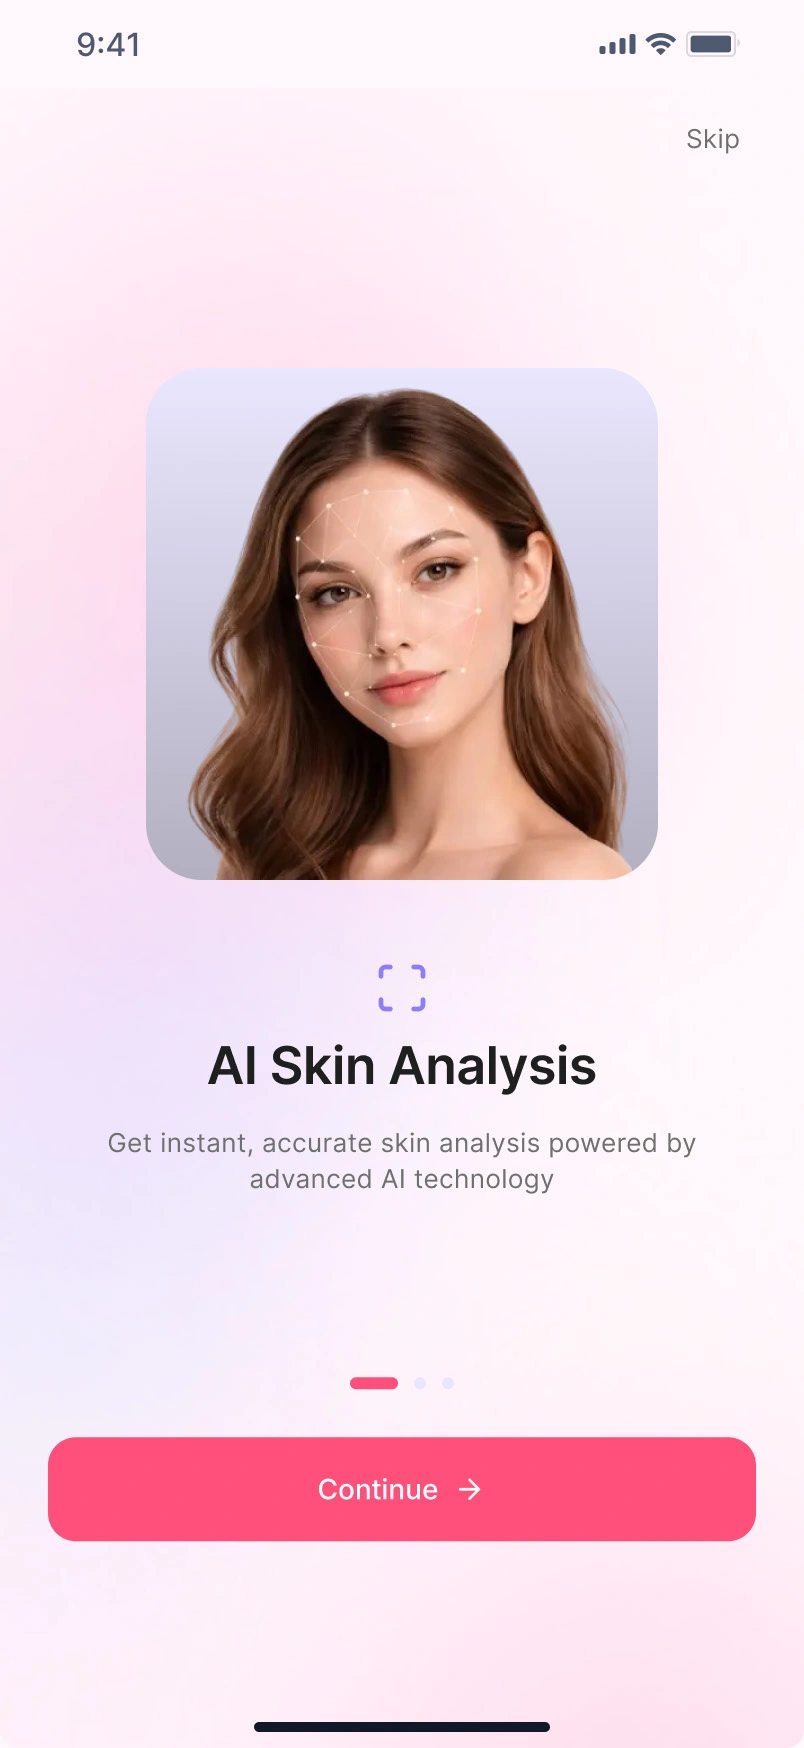
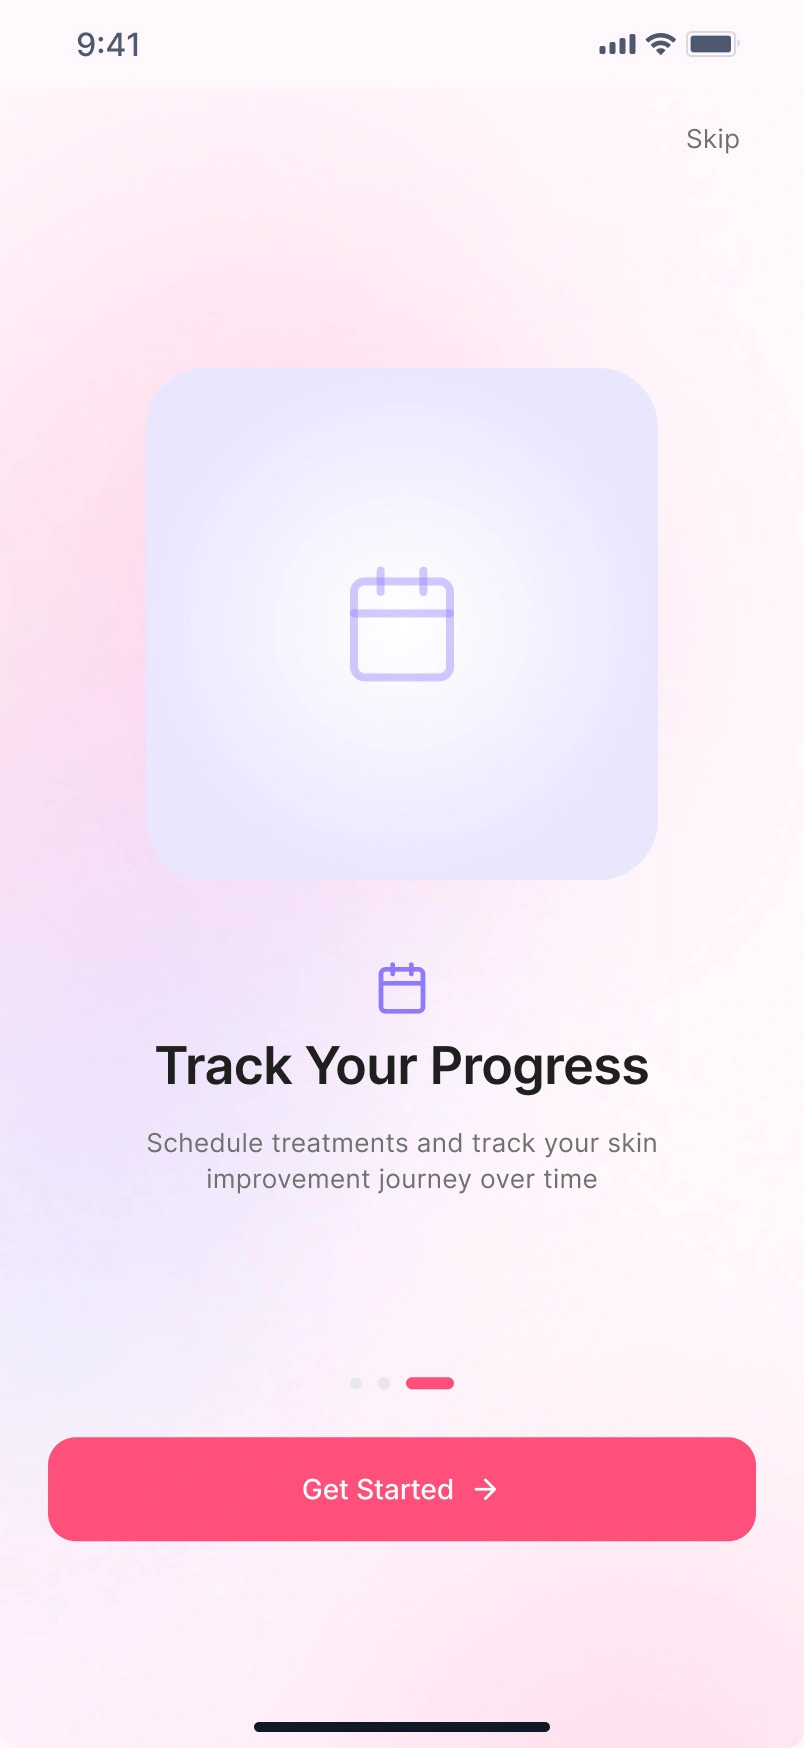
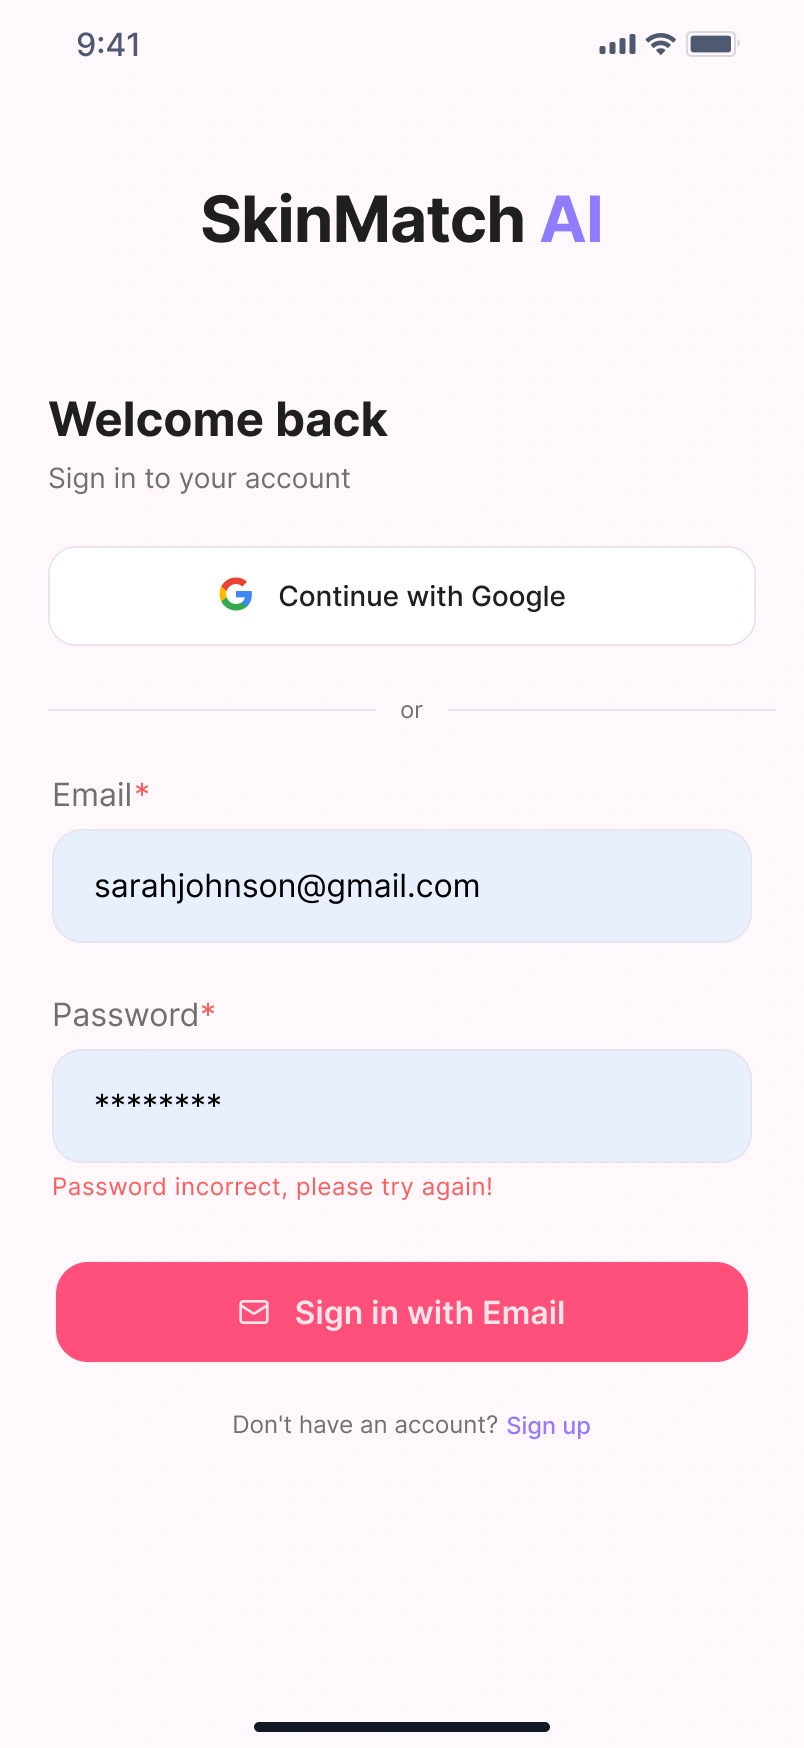
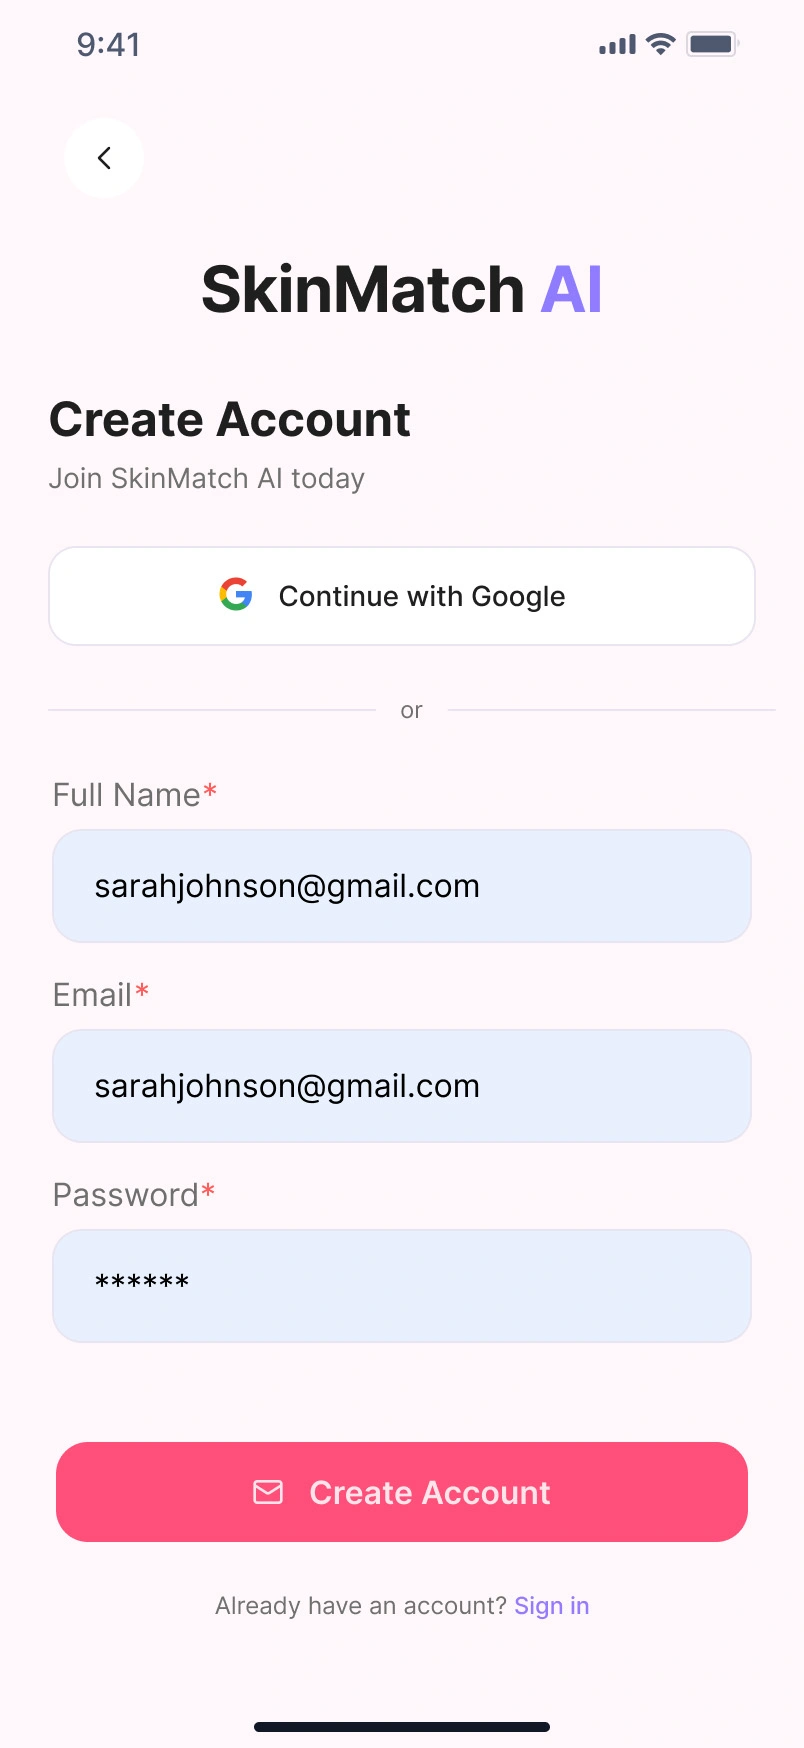
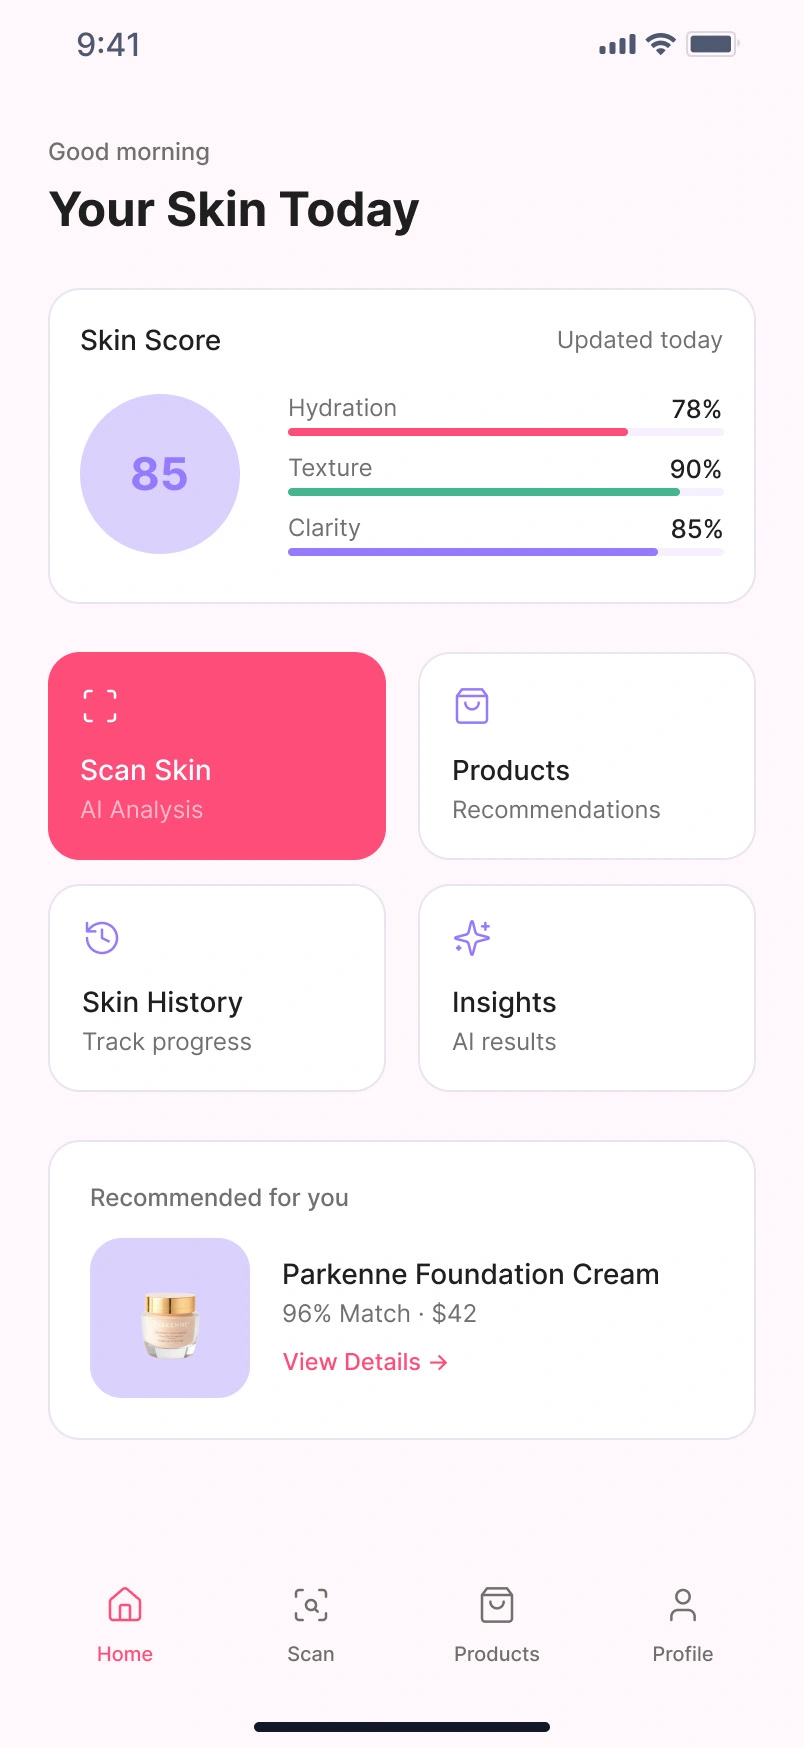
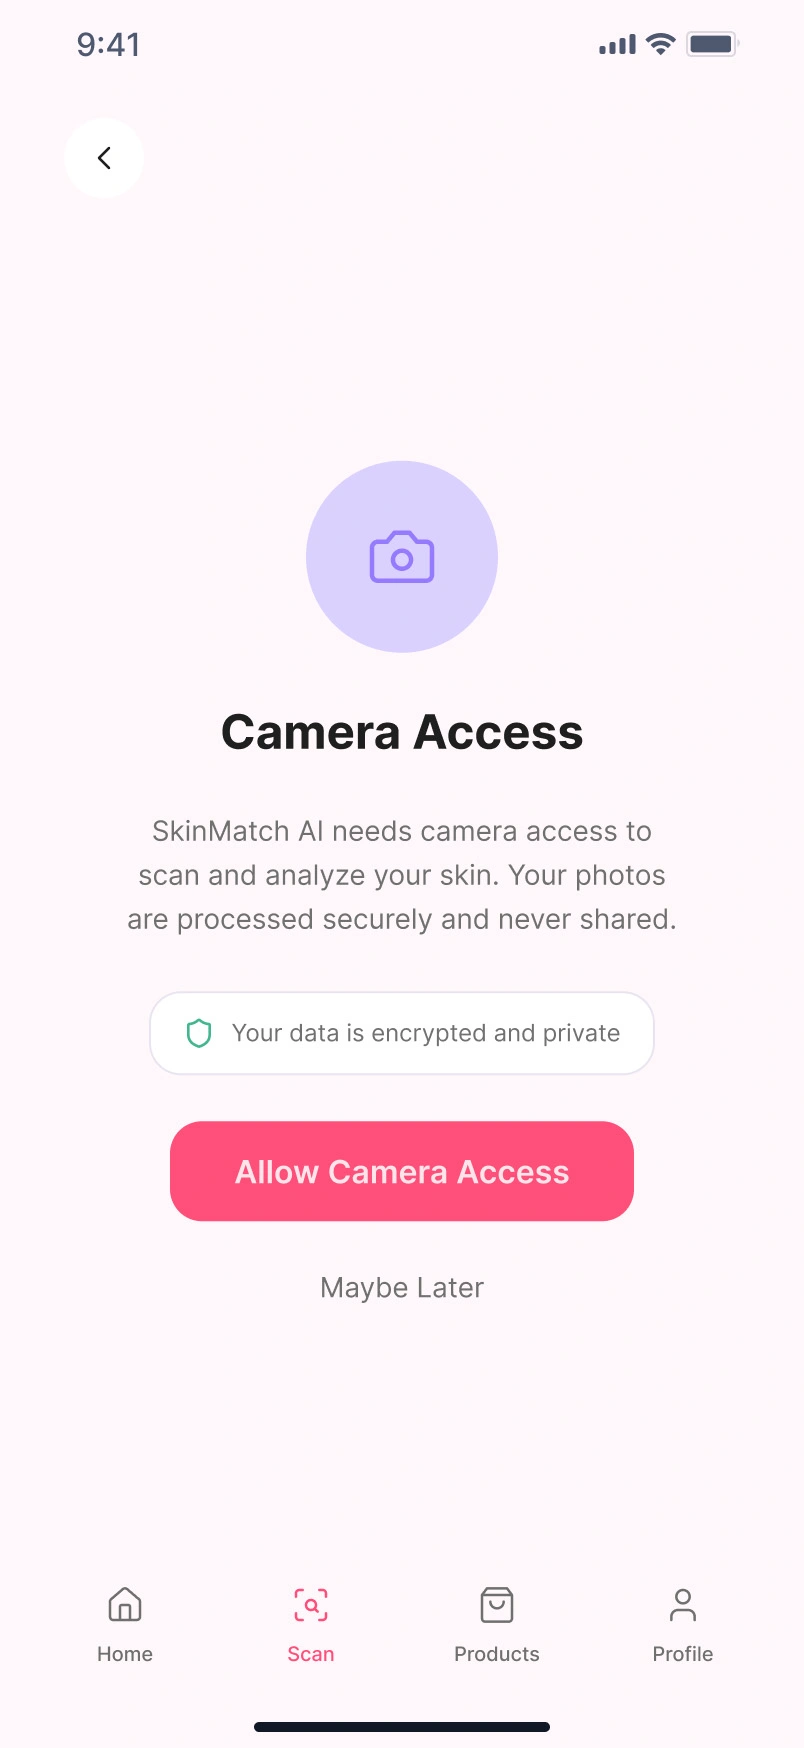
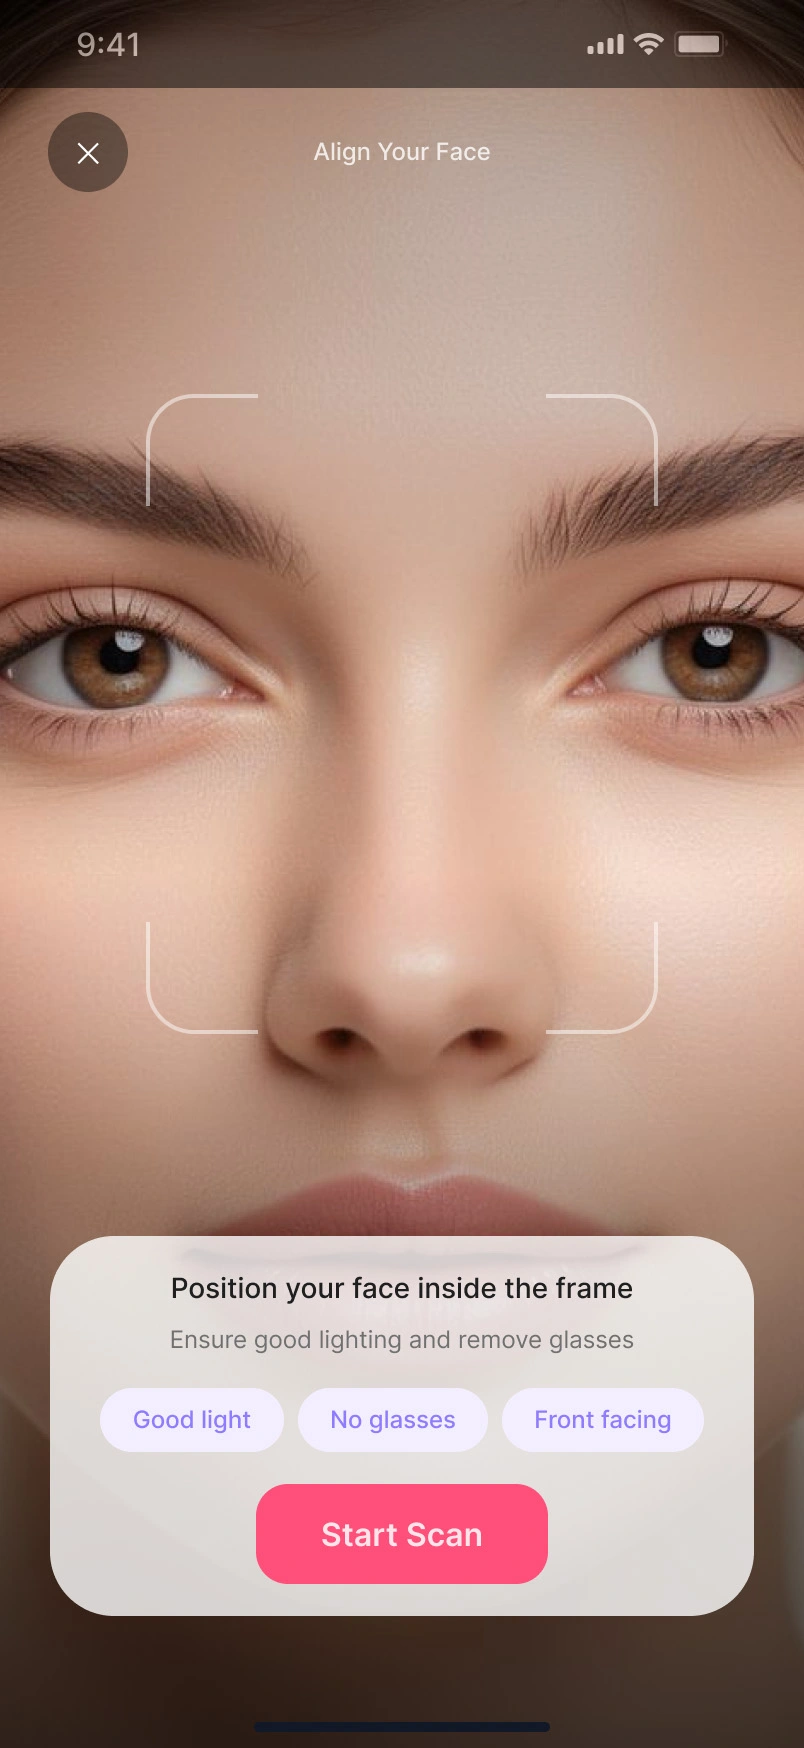
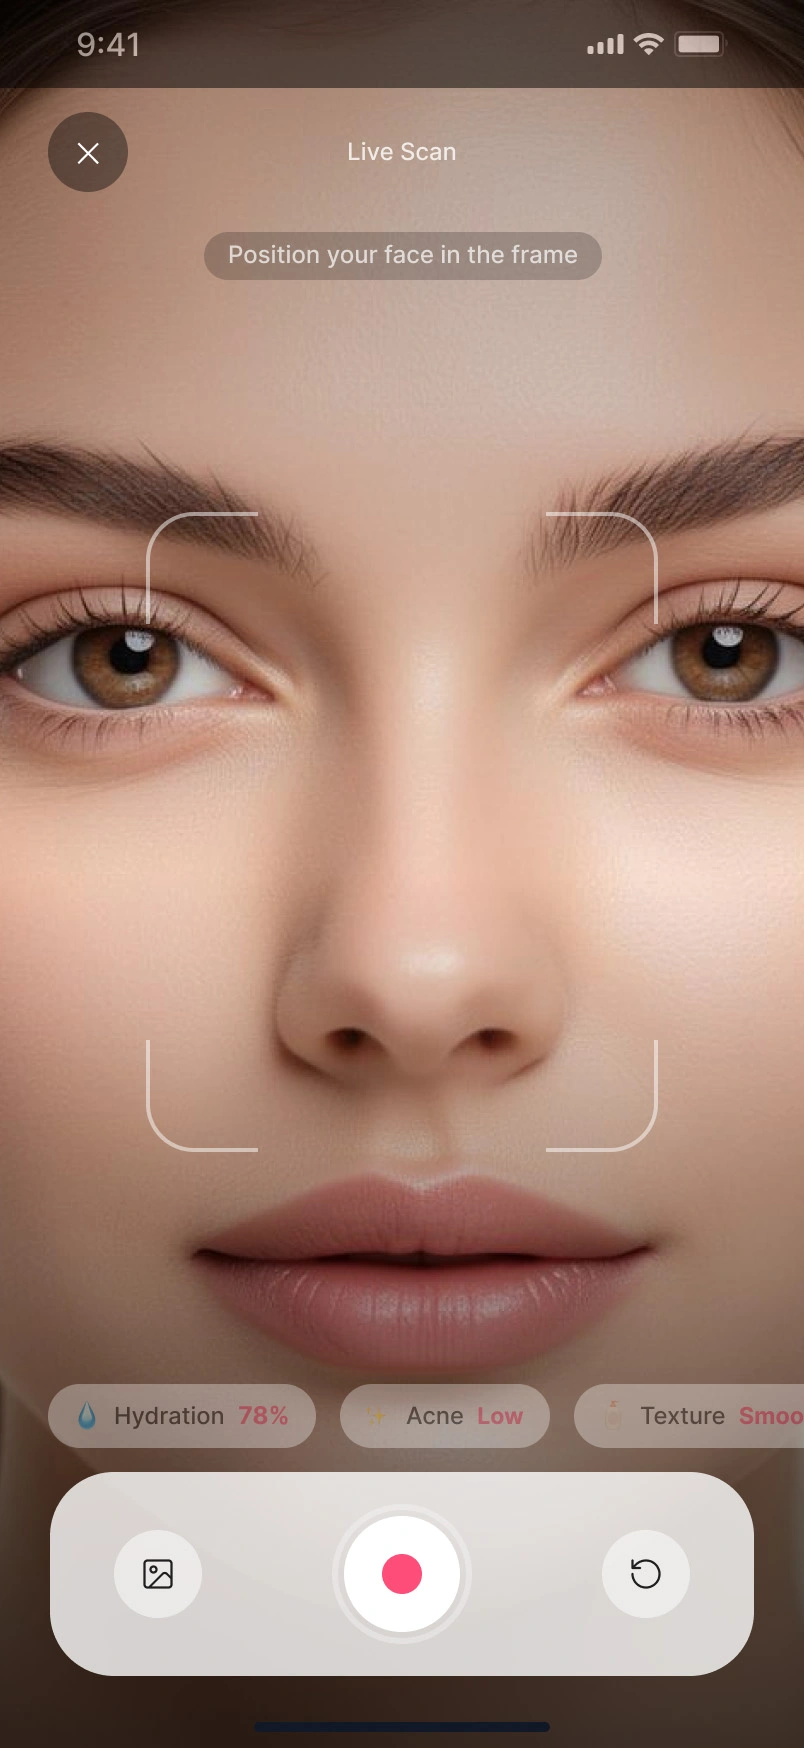
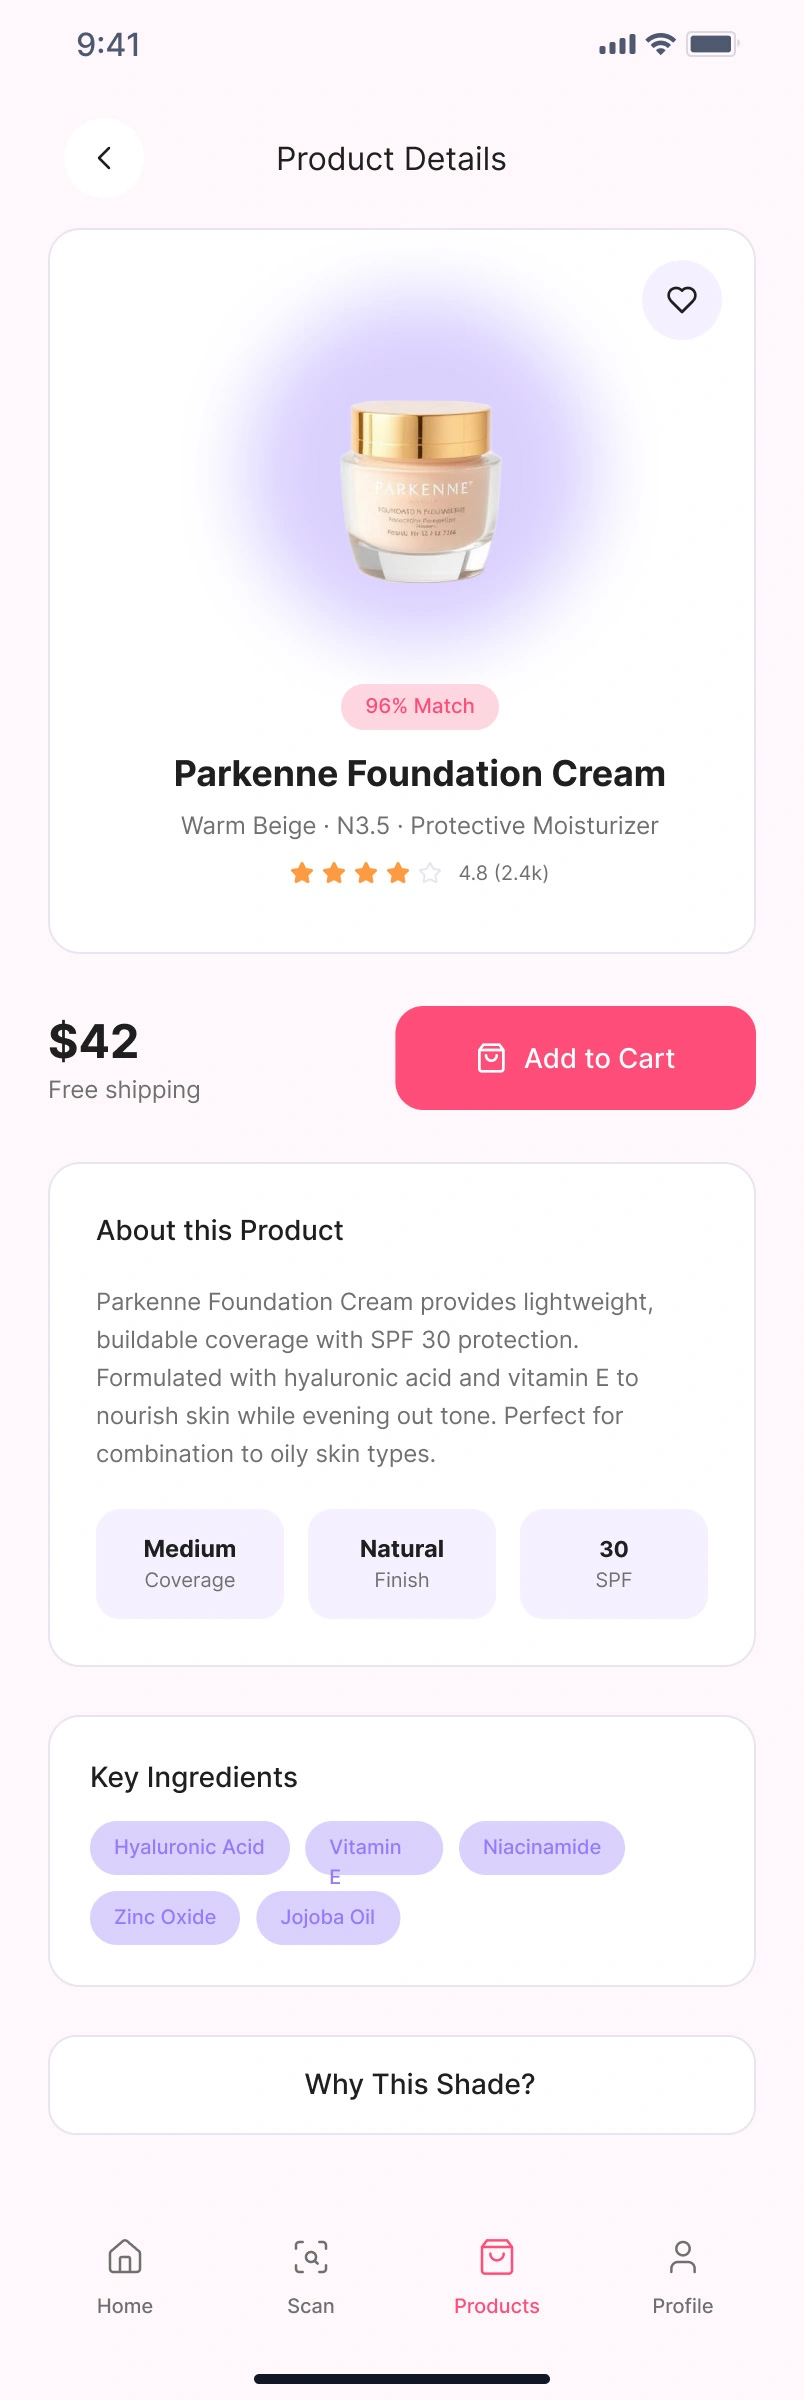
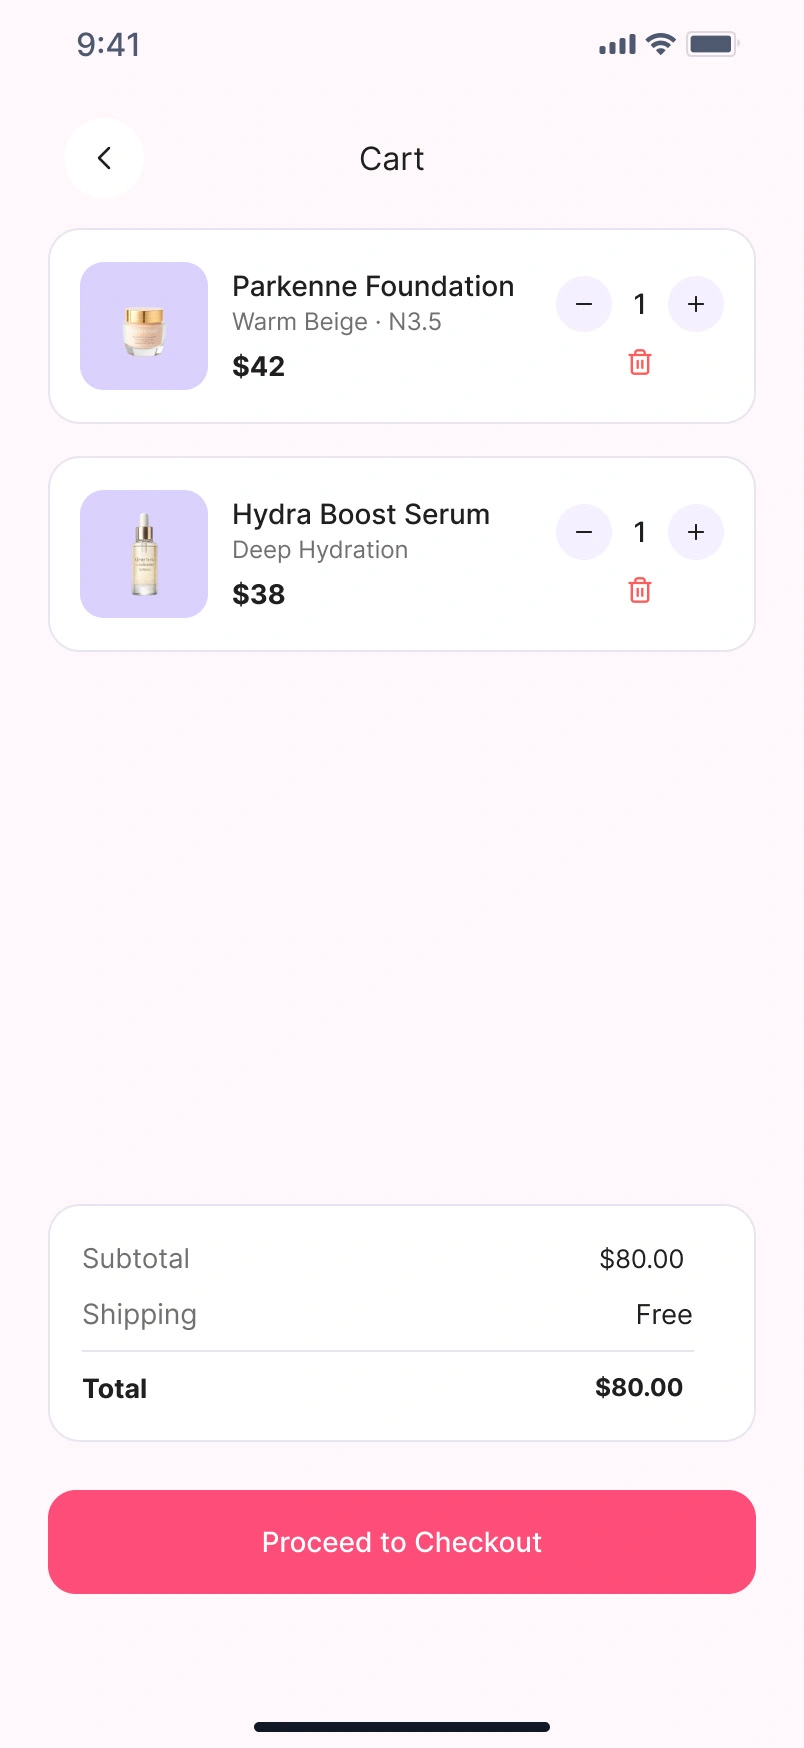
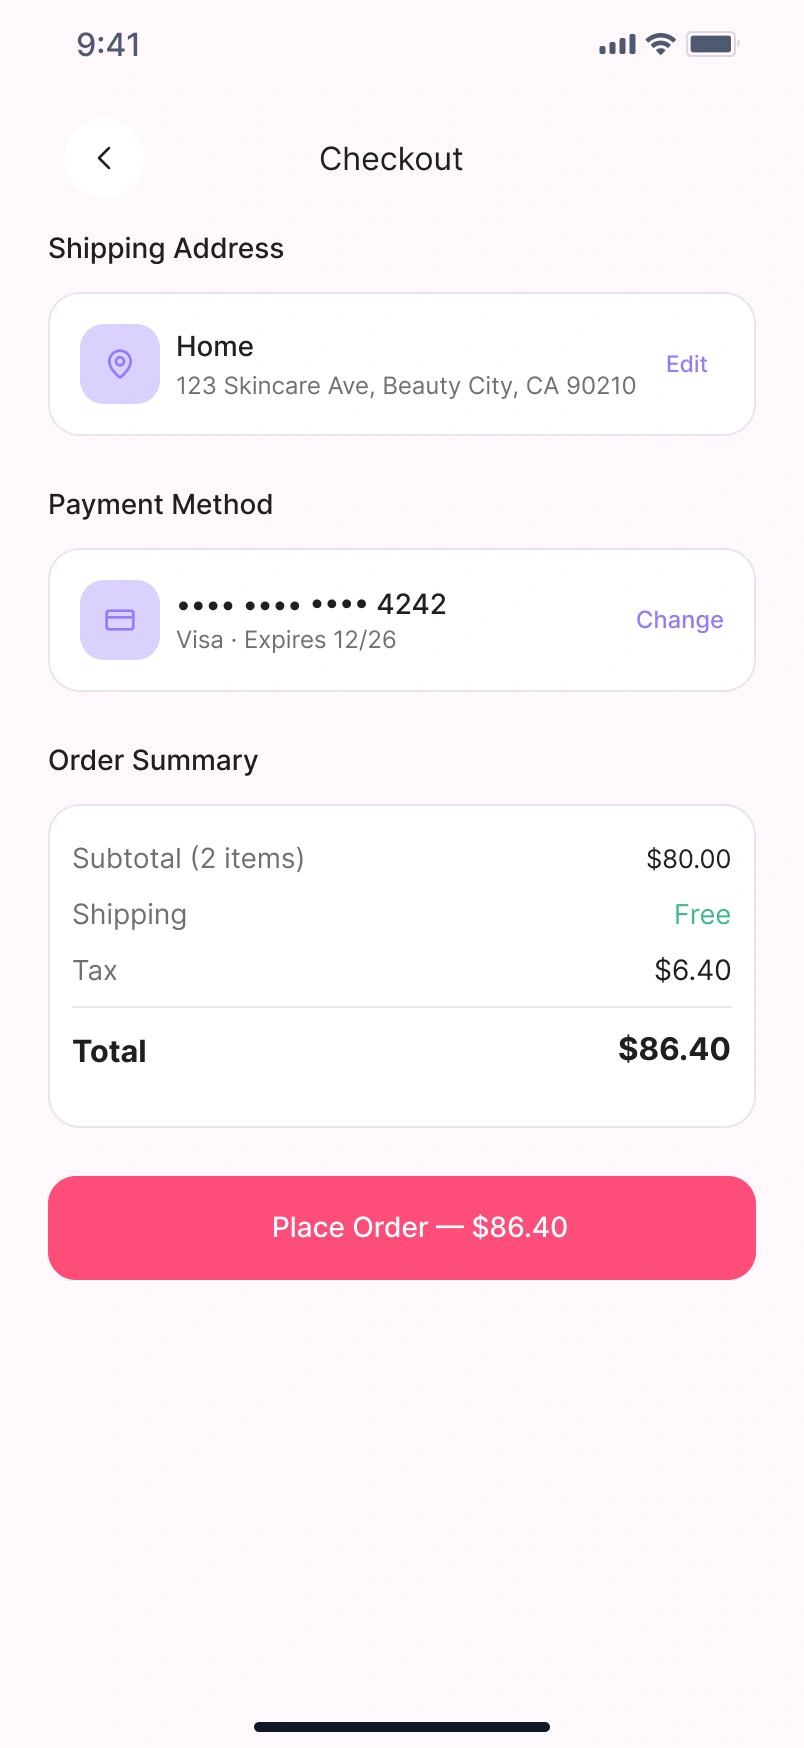
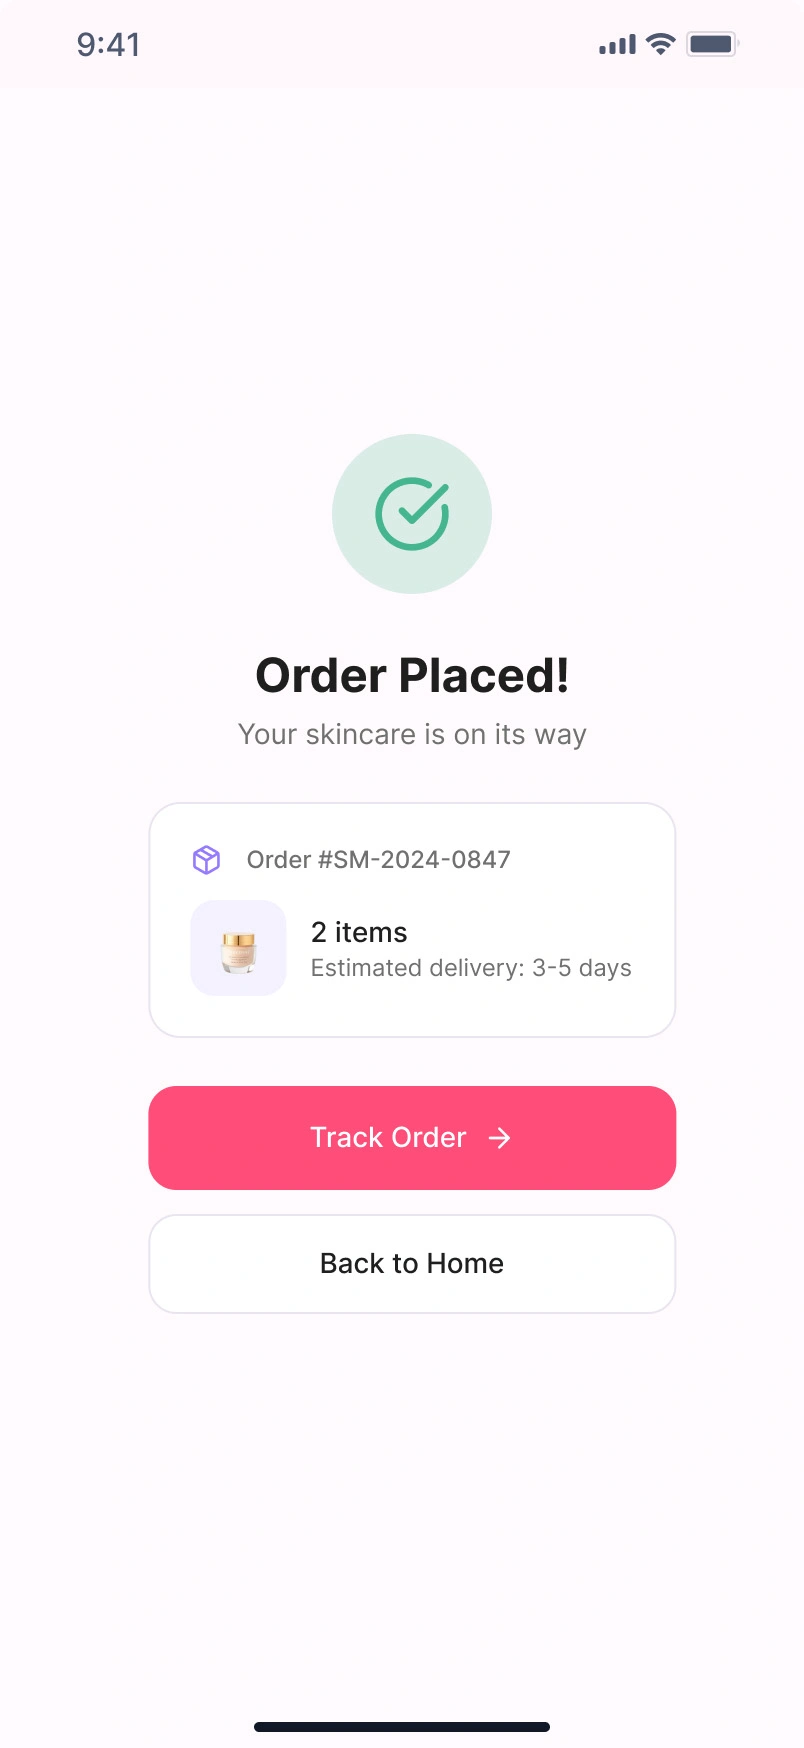
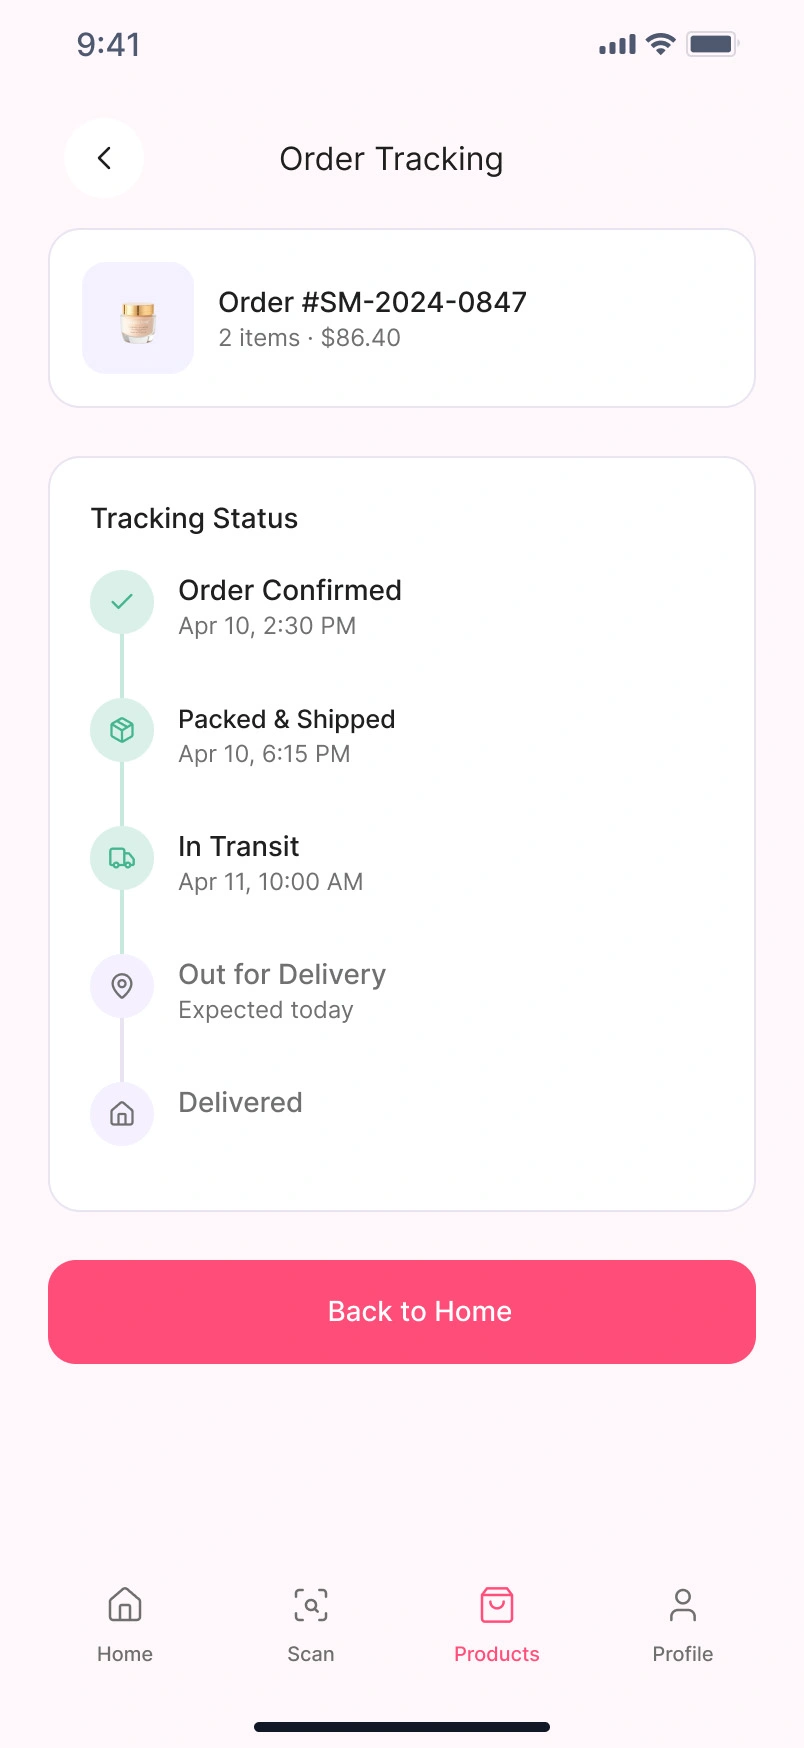
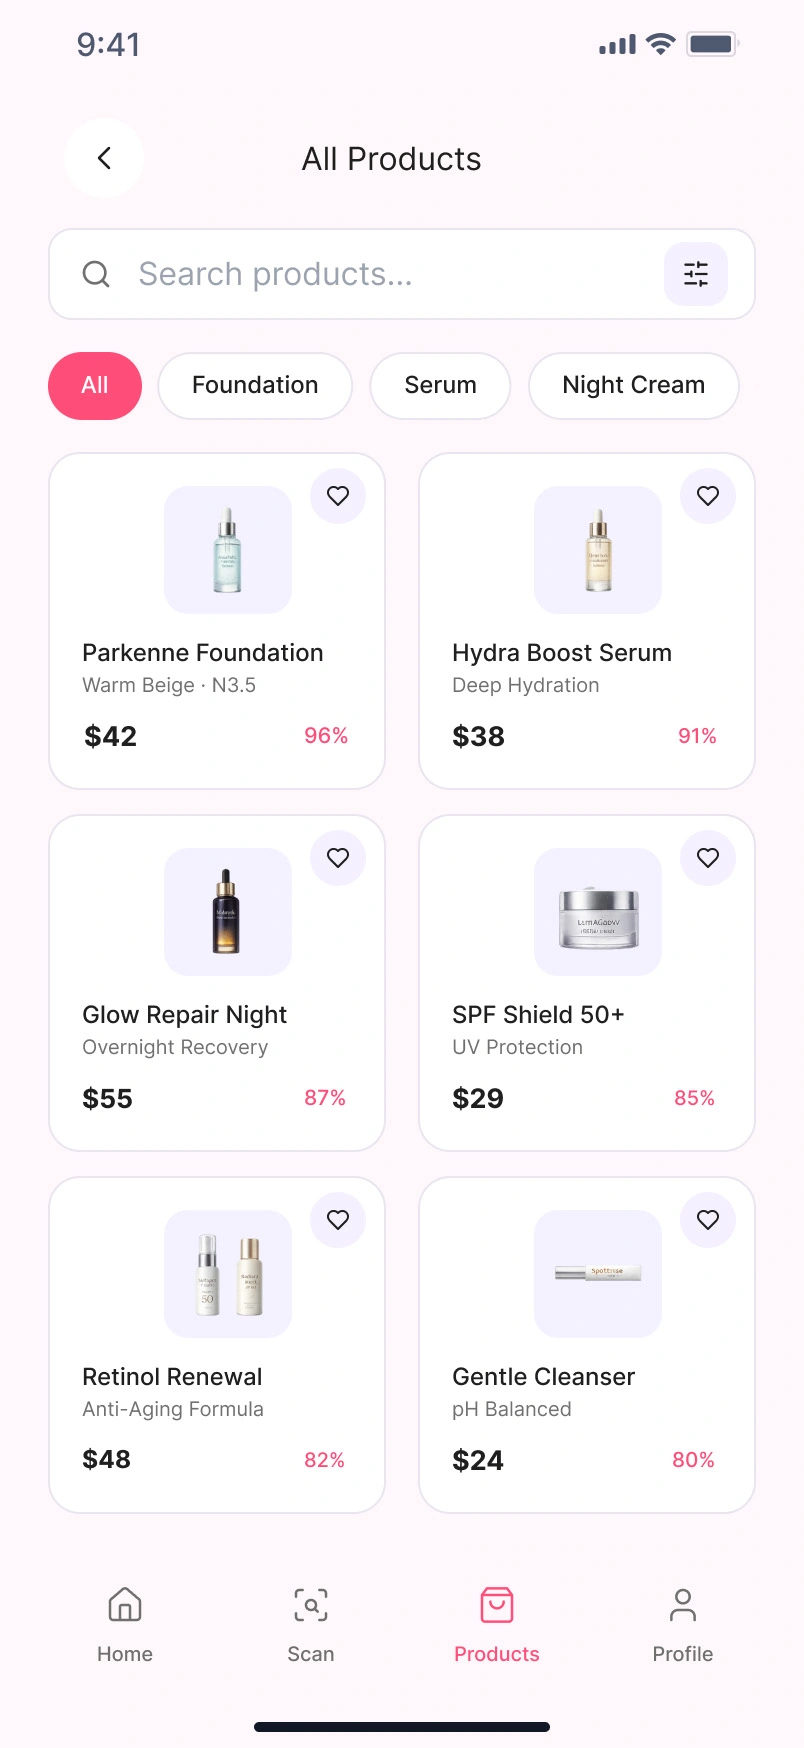
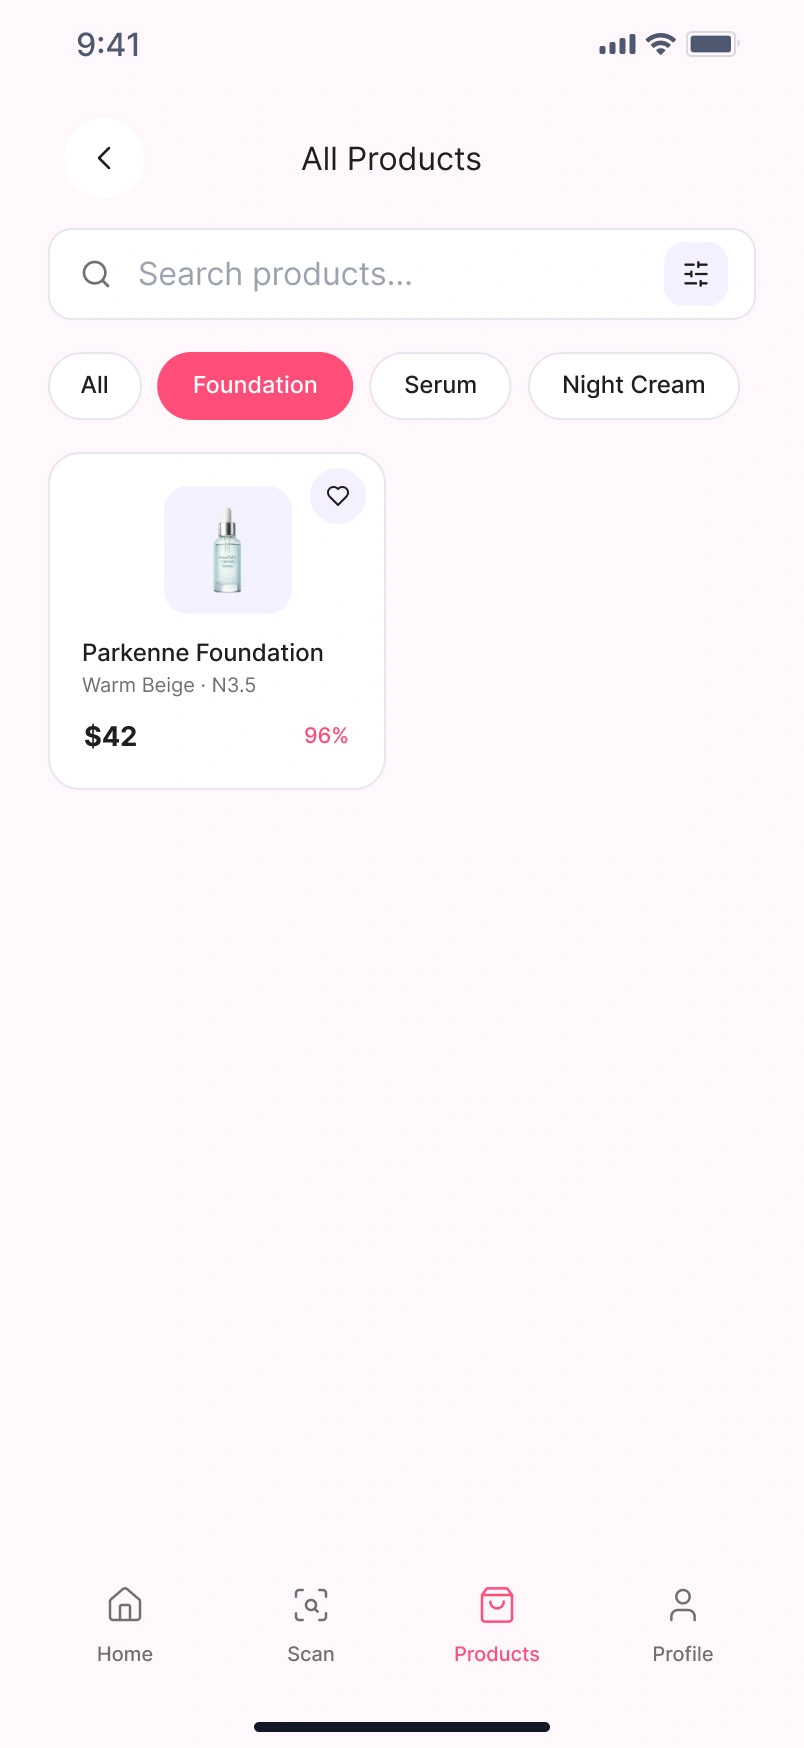
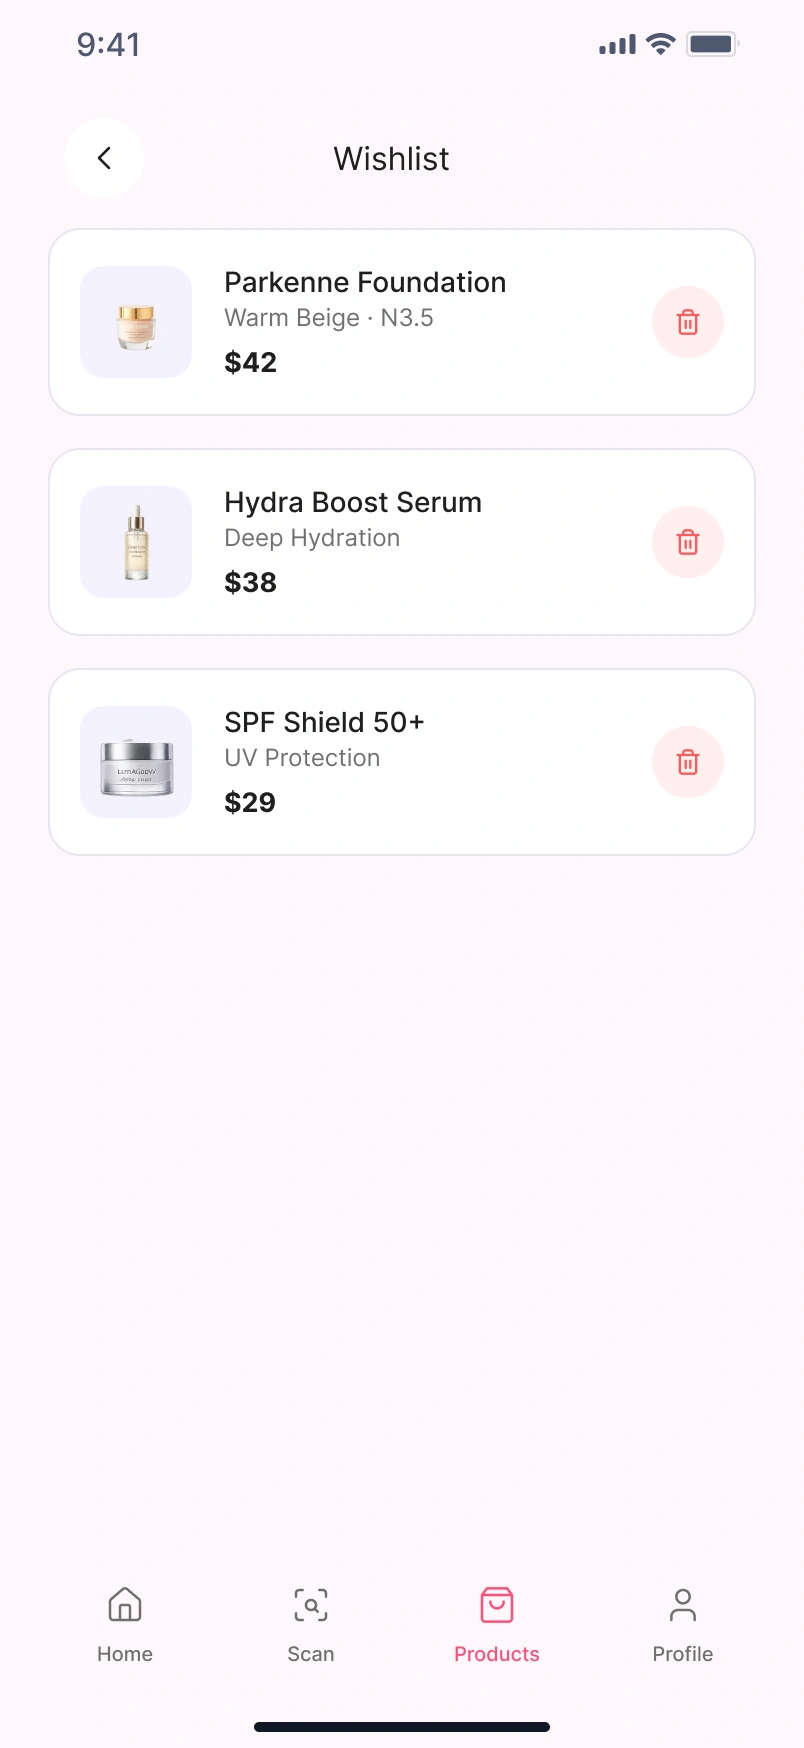
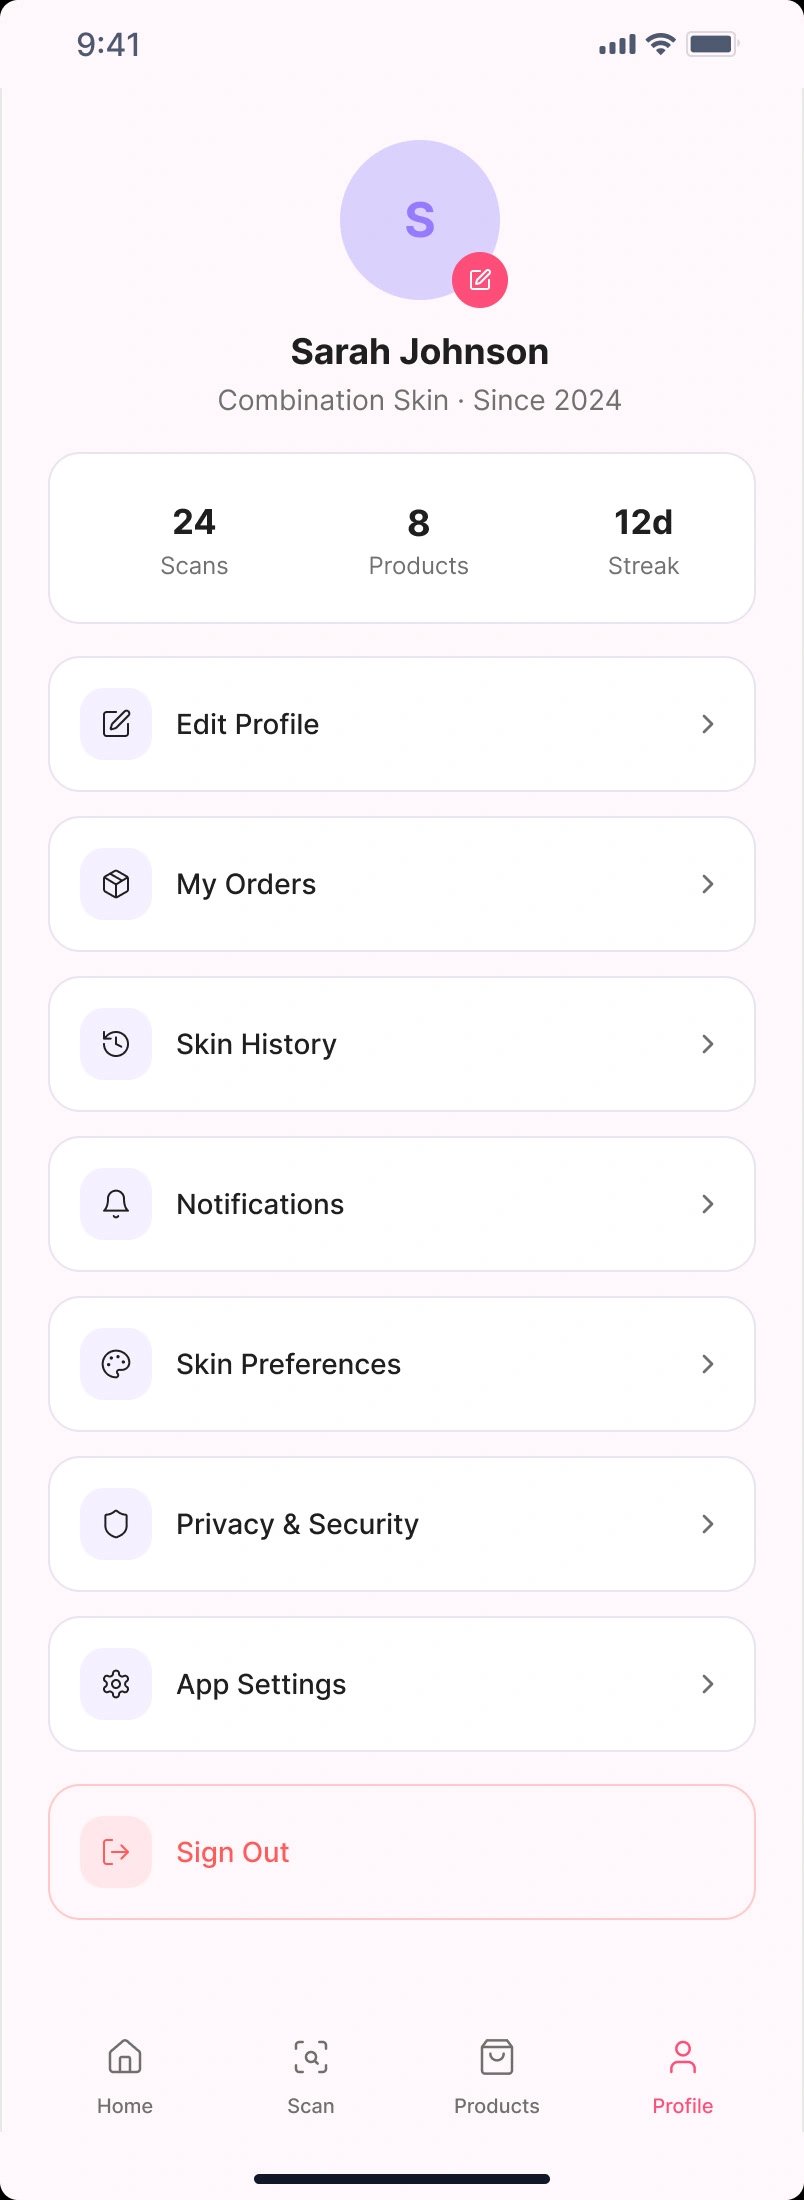
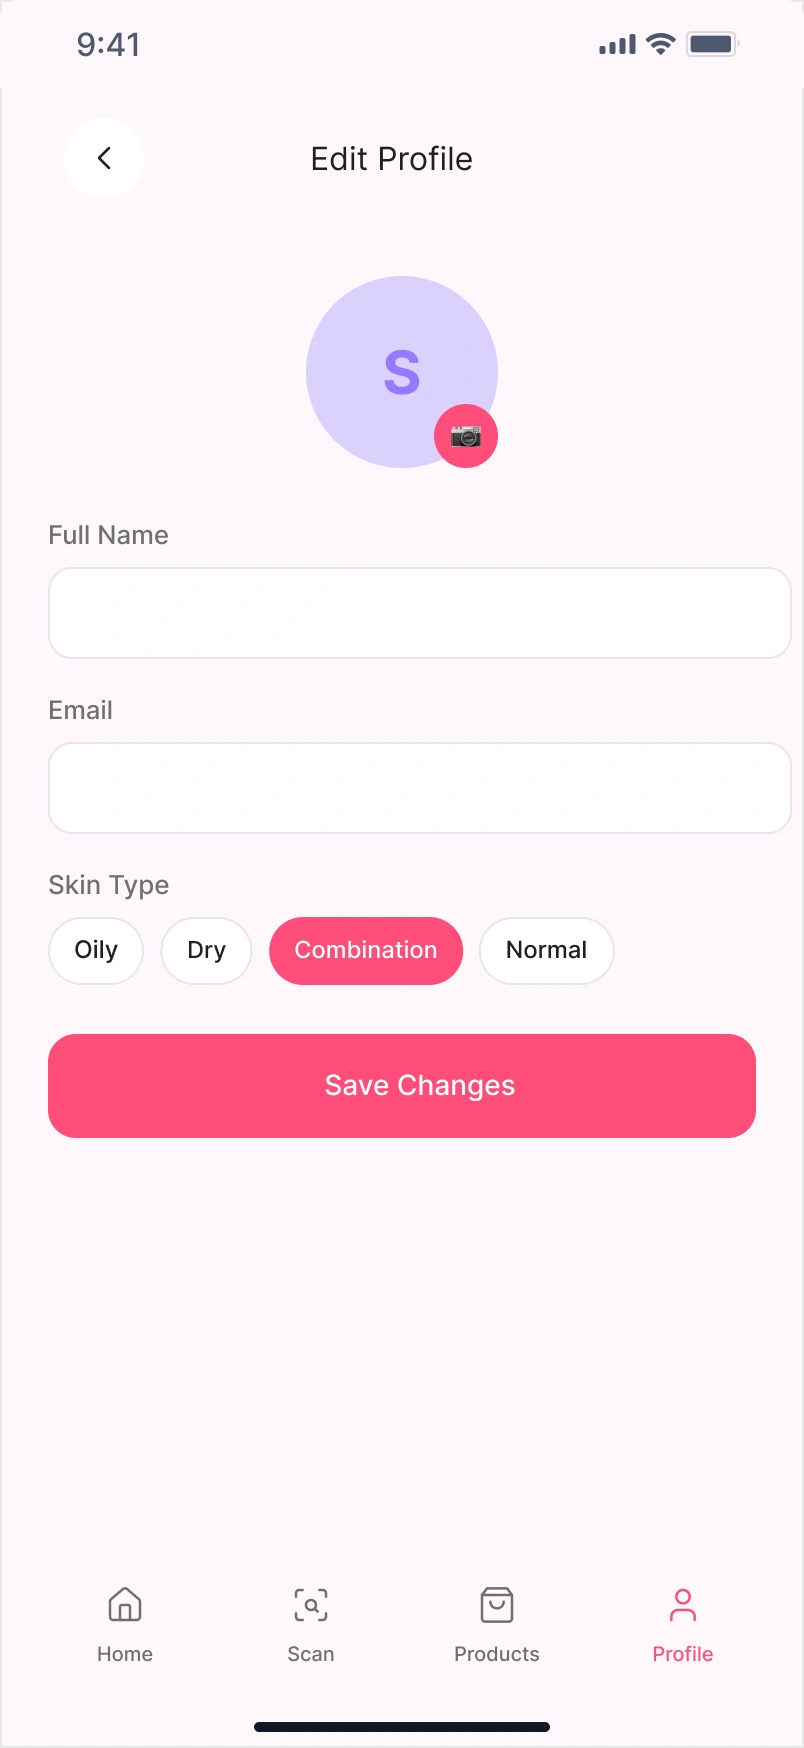
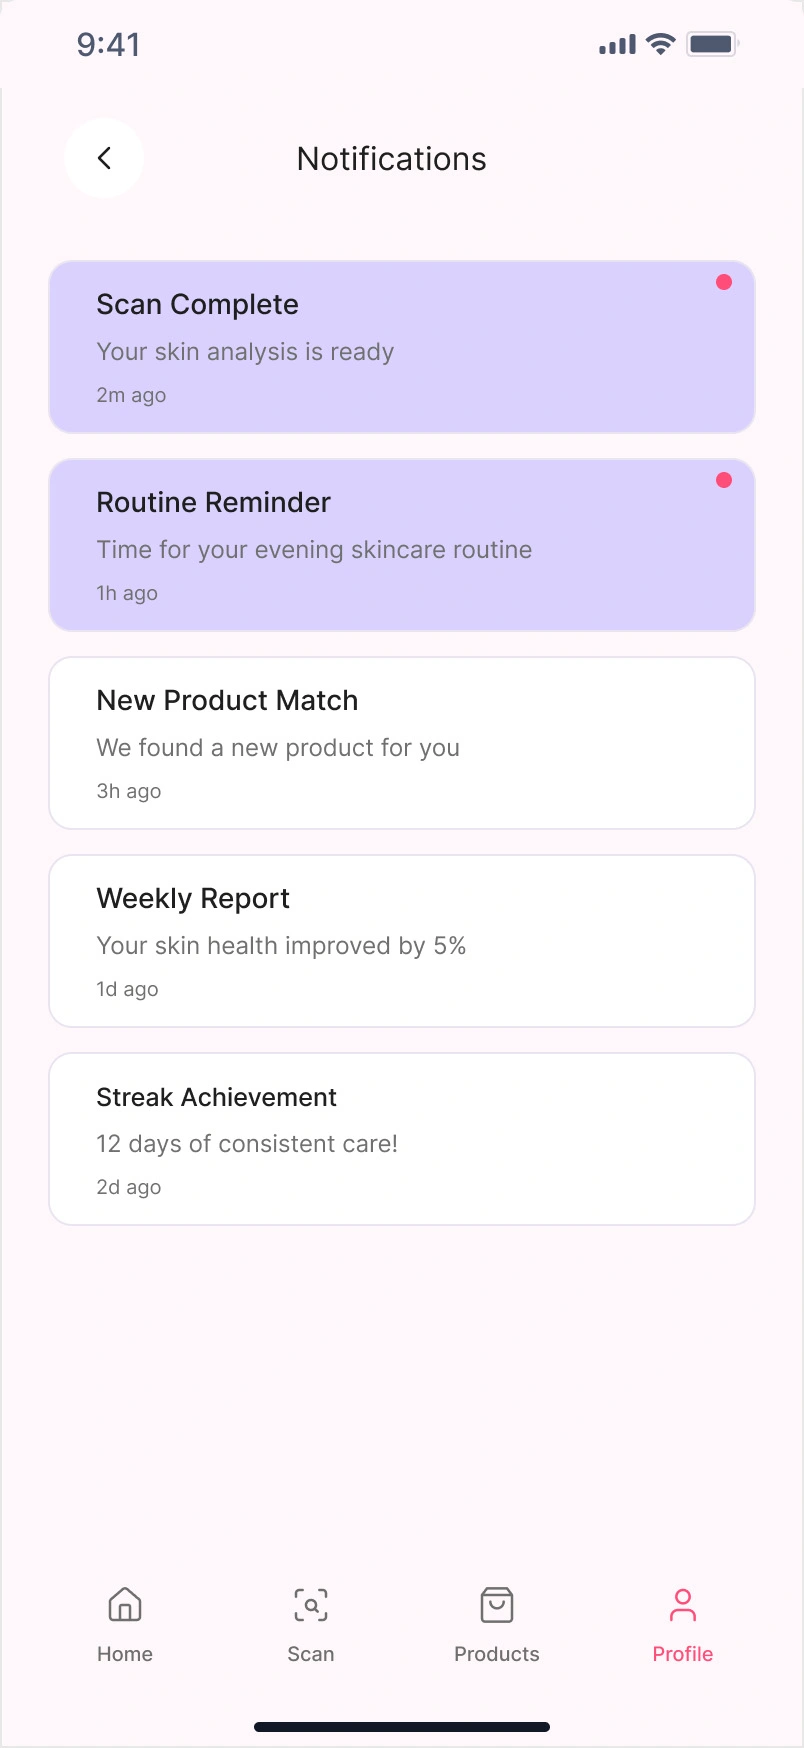
Key Screens
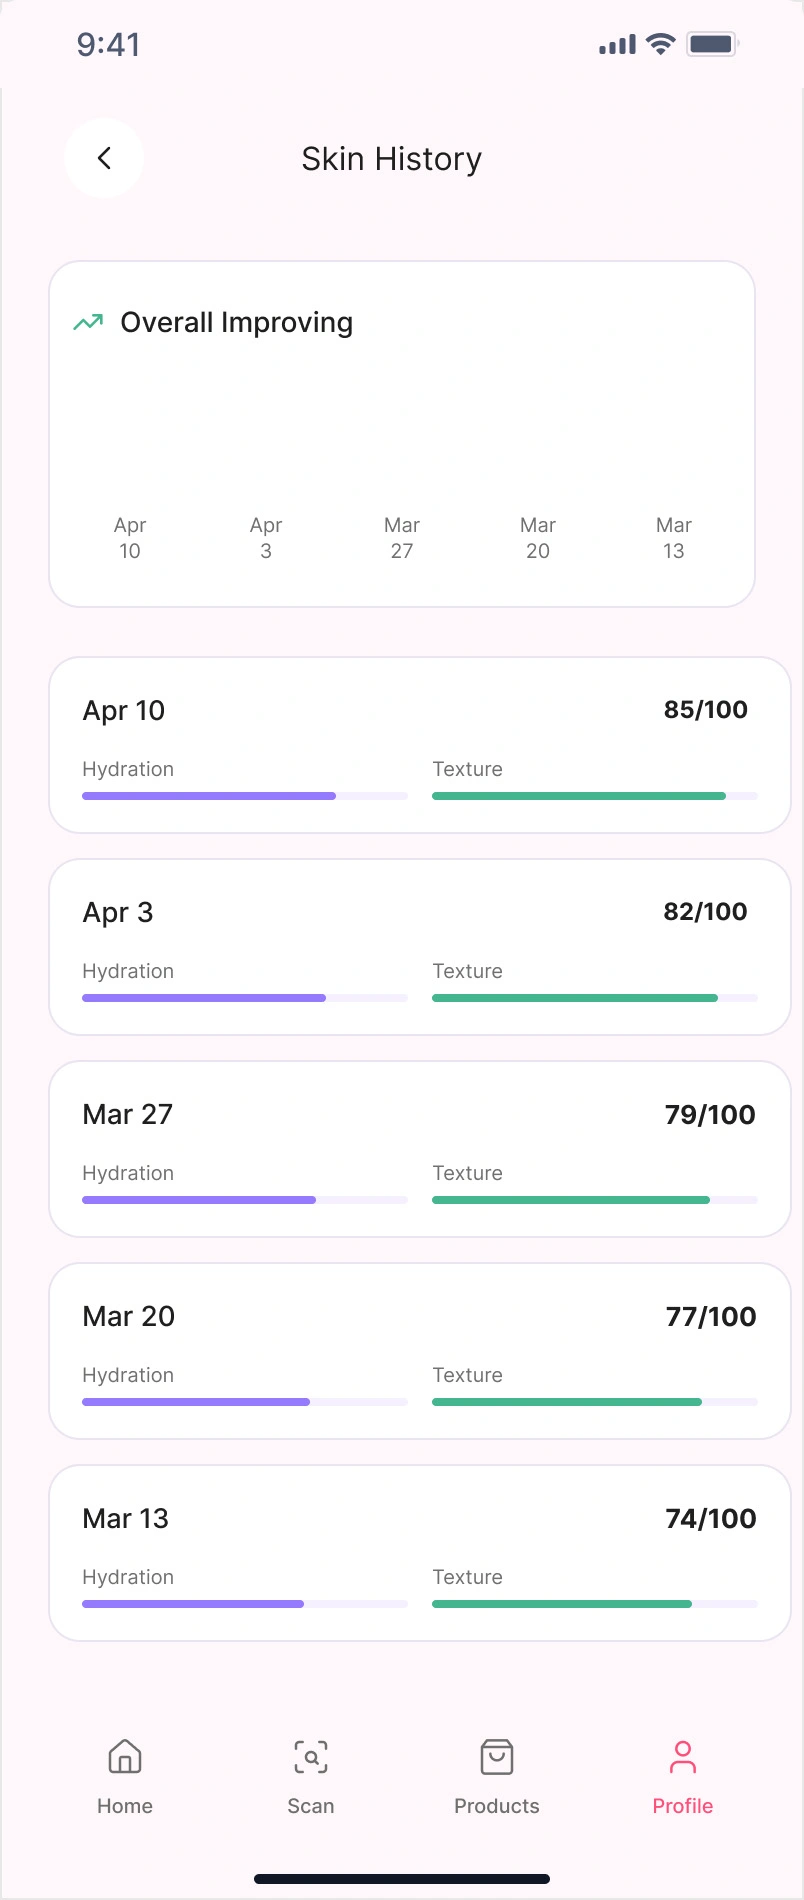
Dashboard Overview
Central hub showing KPIs, trends, and alerts
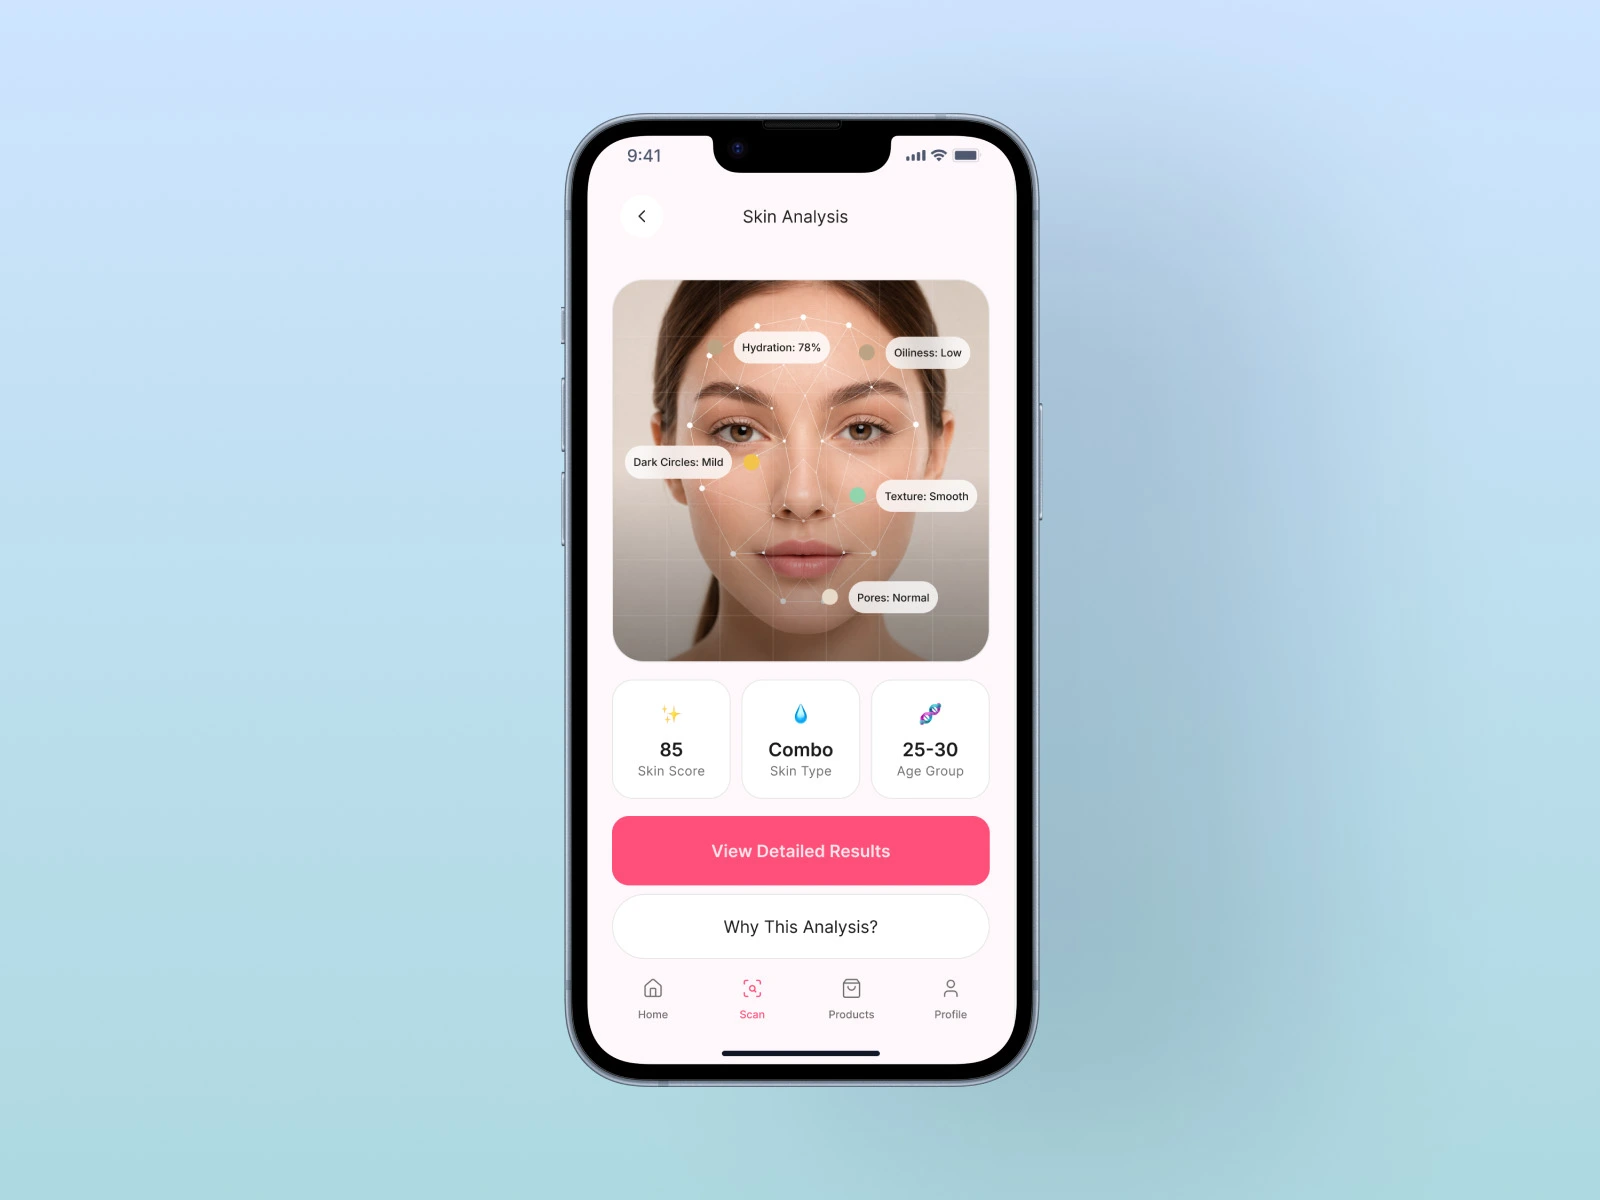
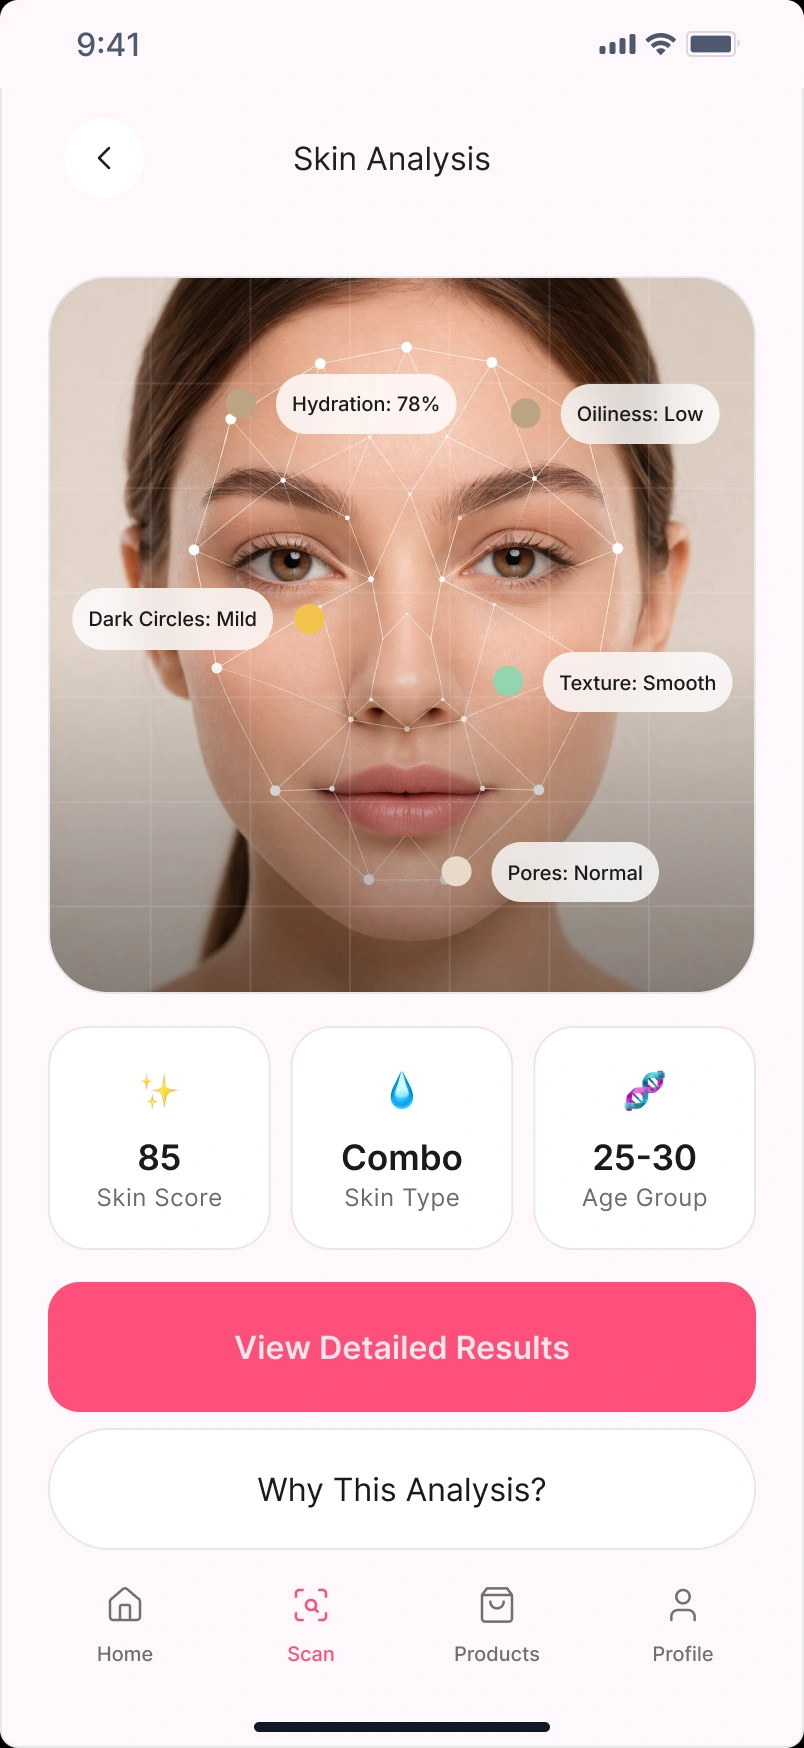
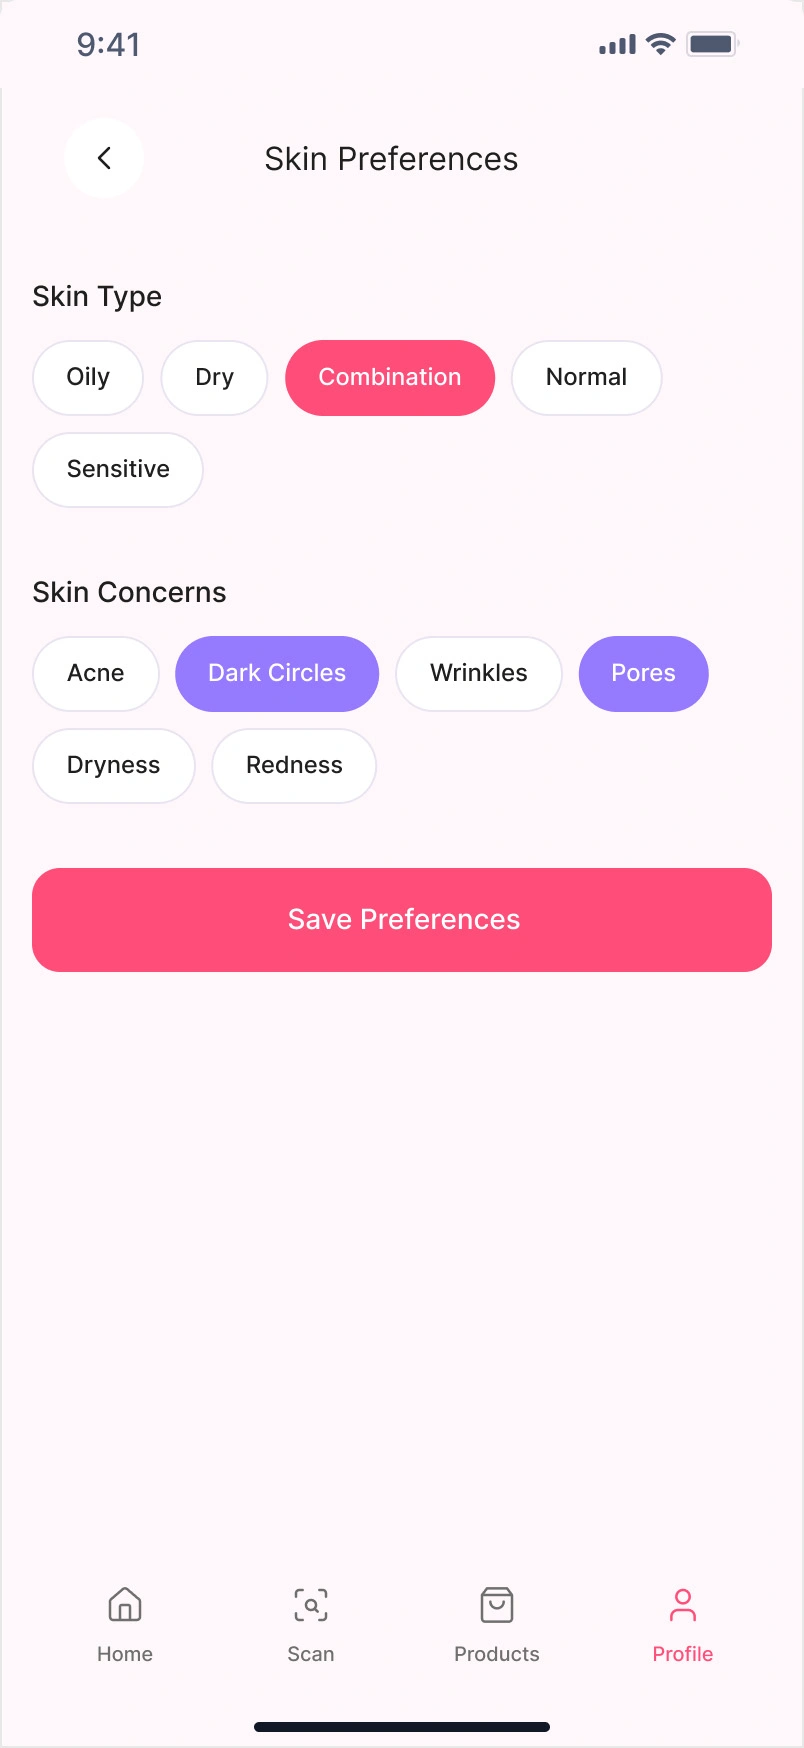
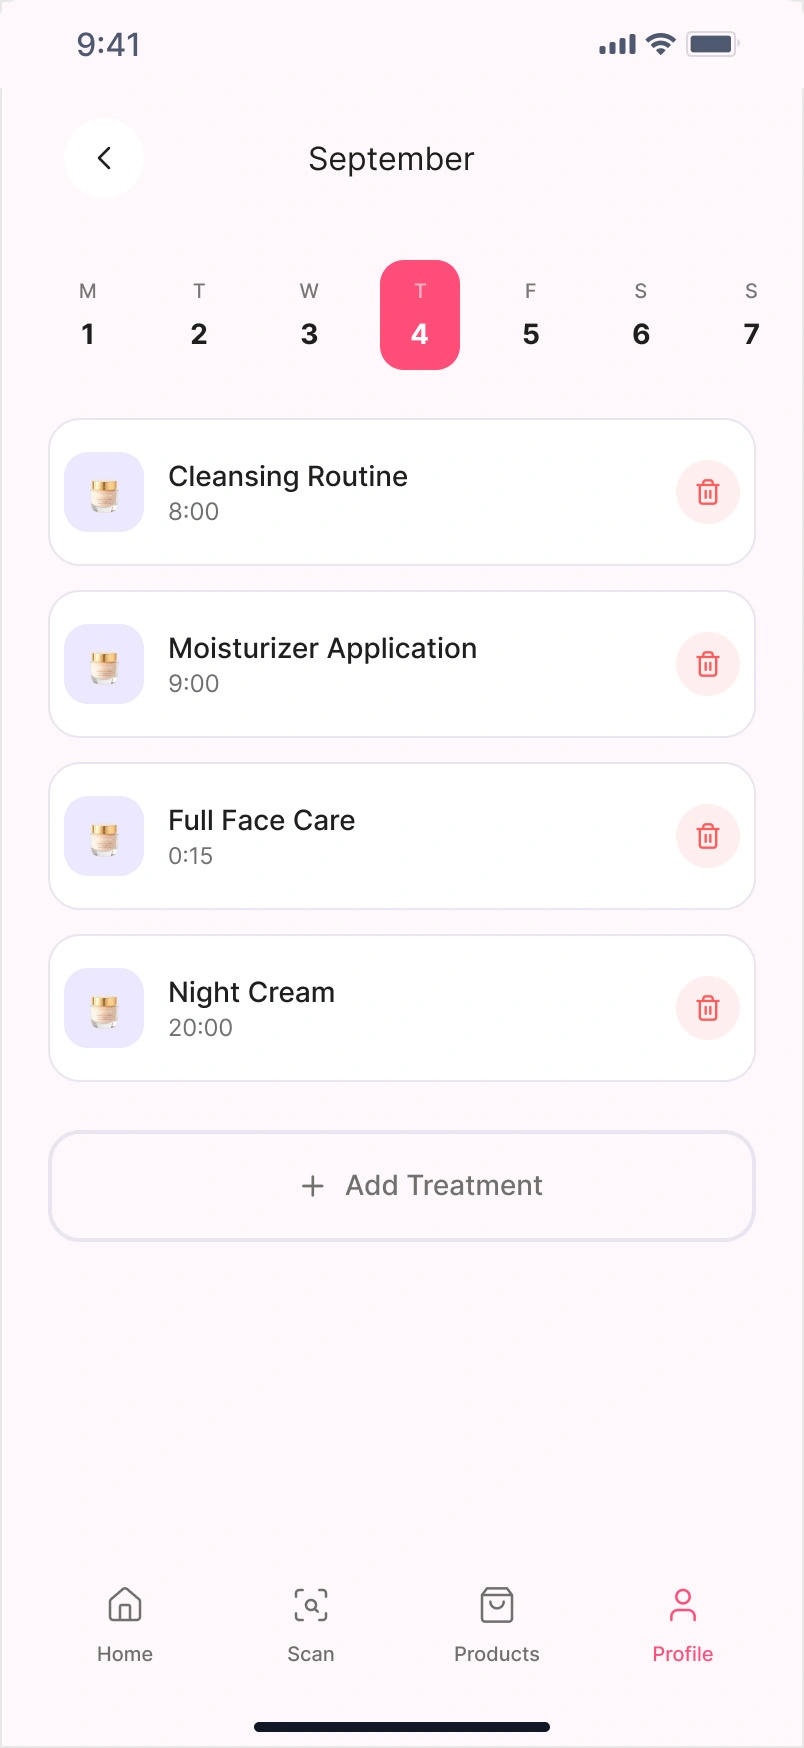
Feedback Analytics
Breakdown of customer feedback and ratings
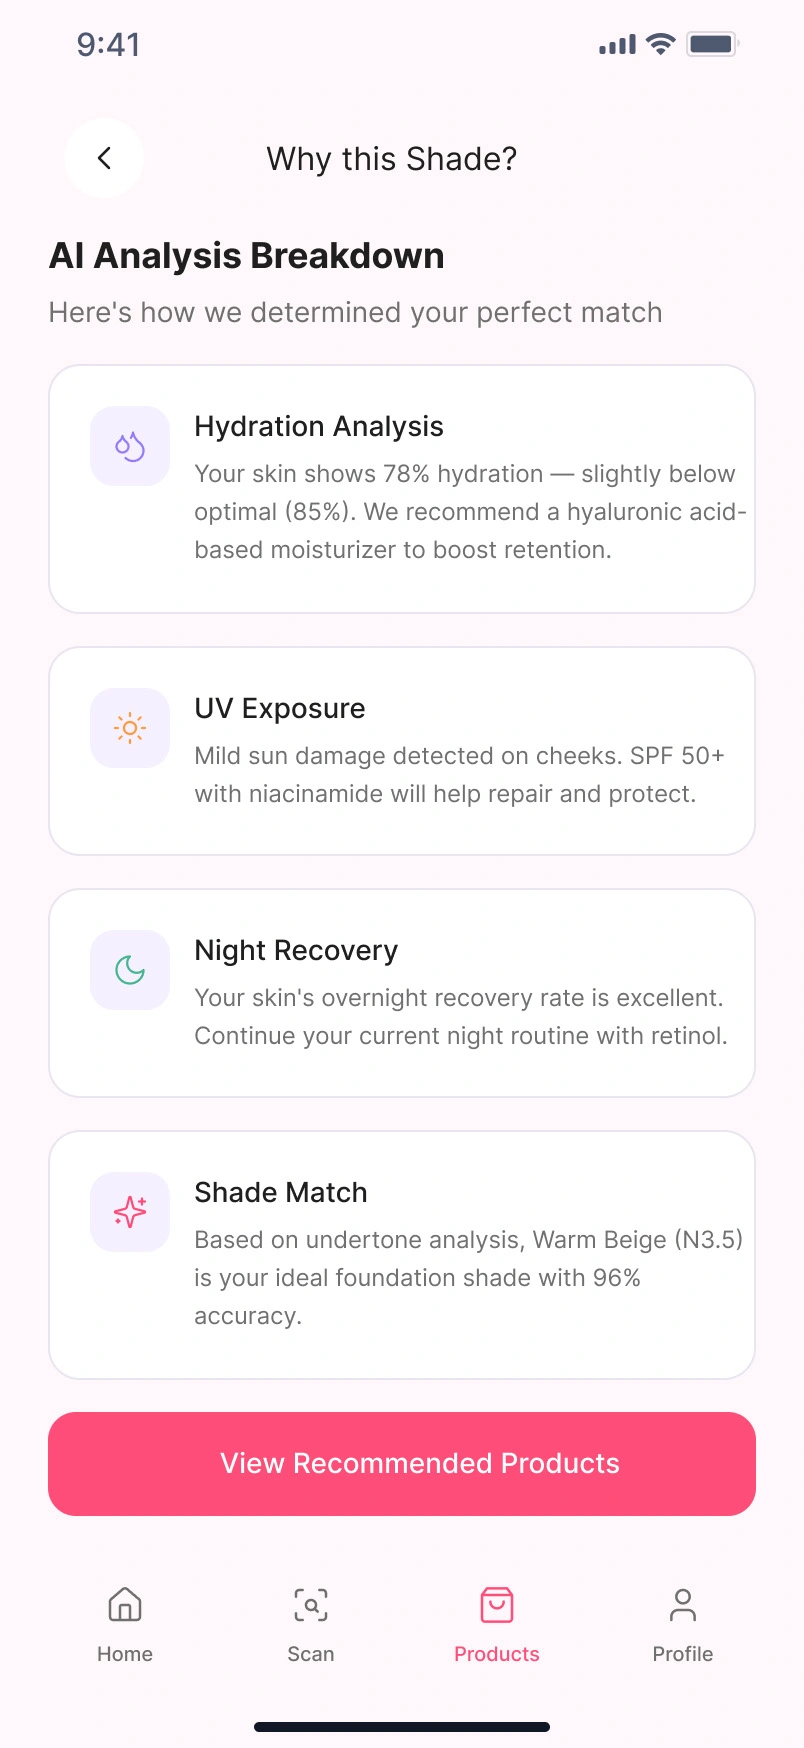
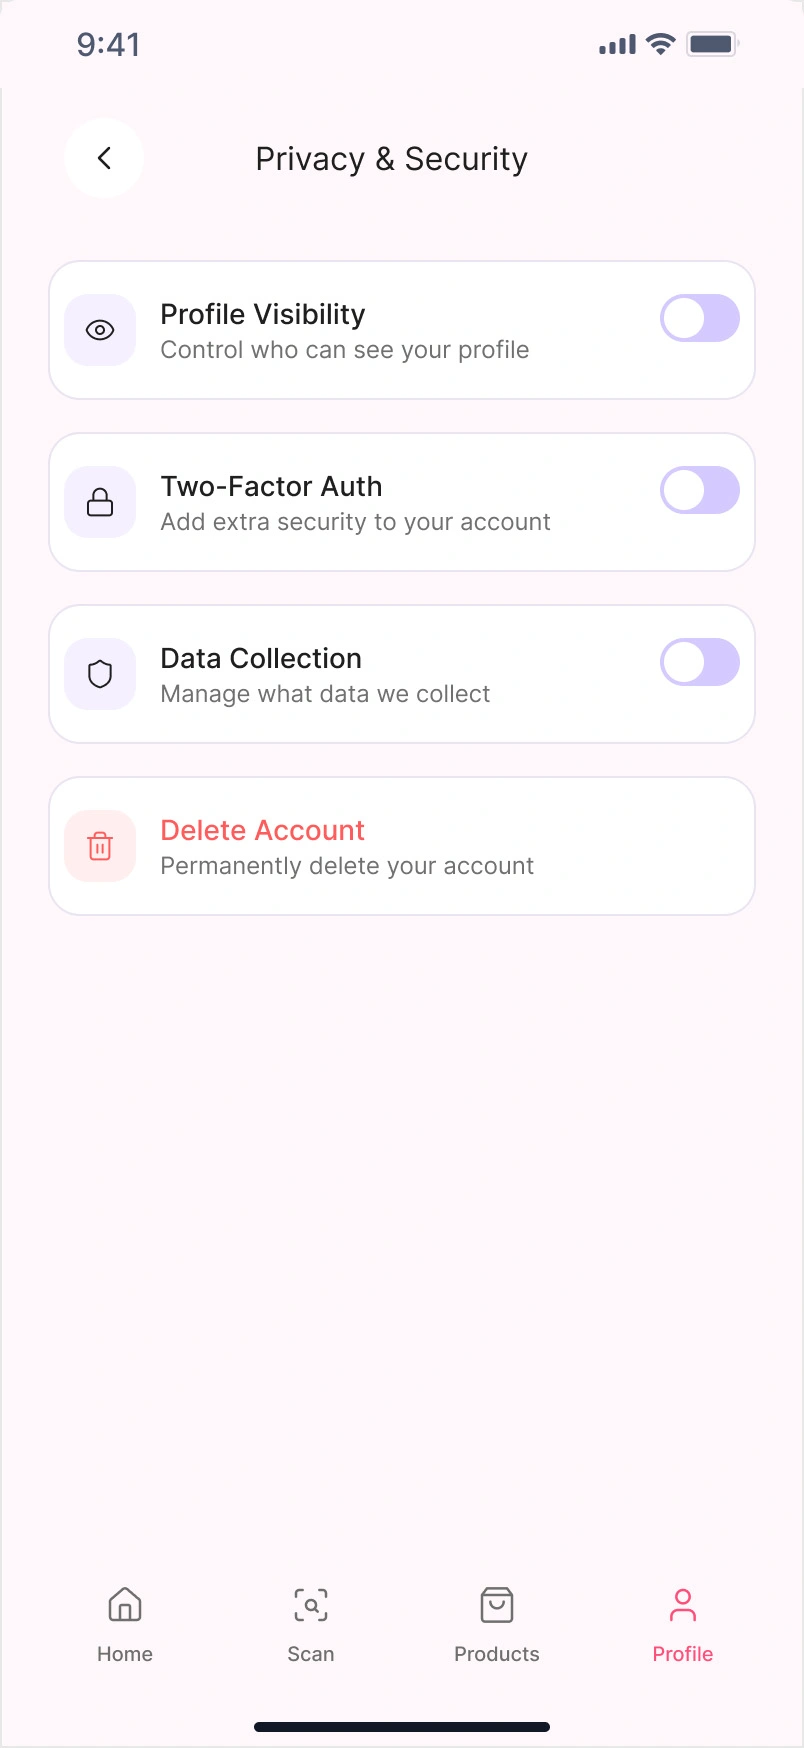
Sentiment Analysis
Visual representation of user sentiment
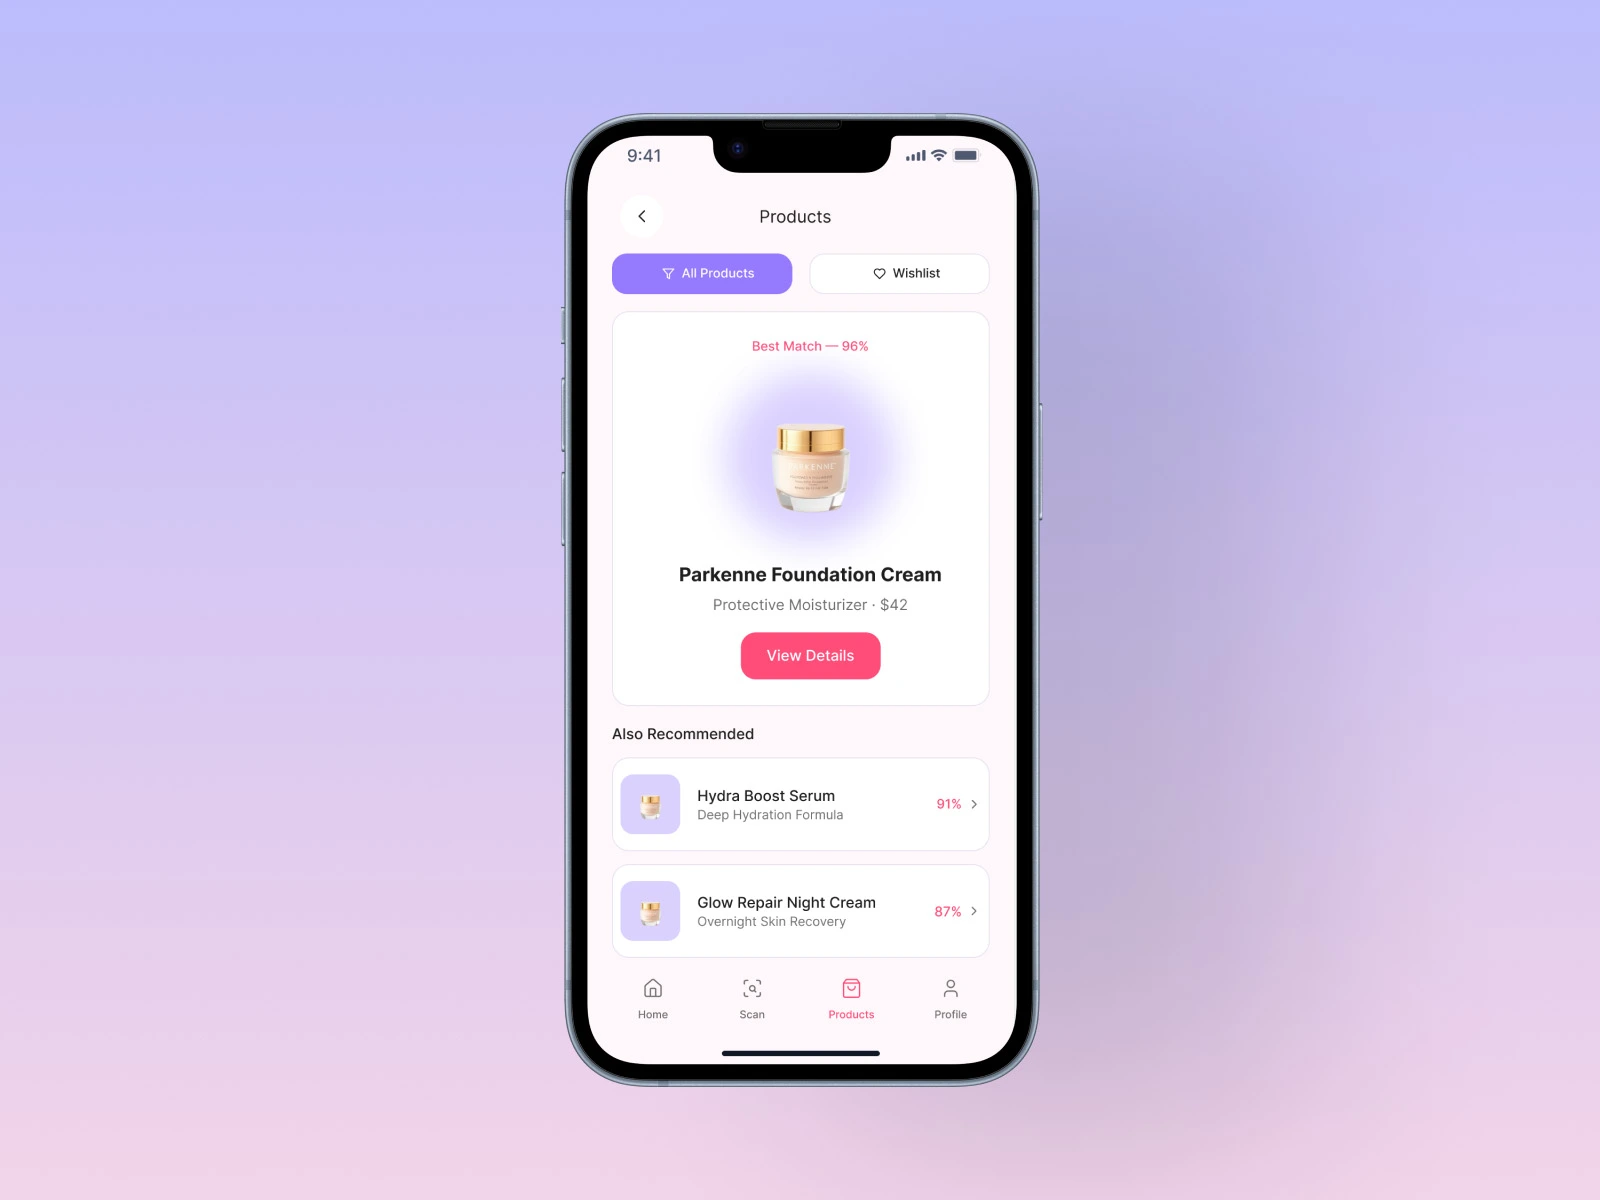
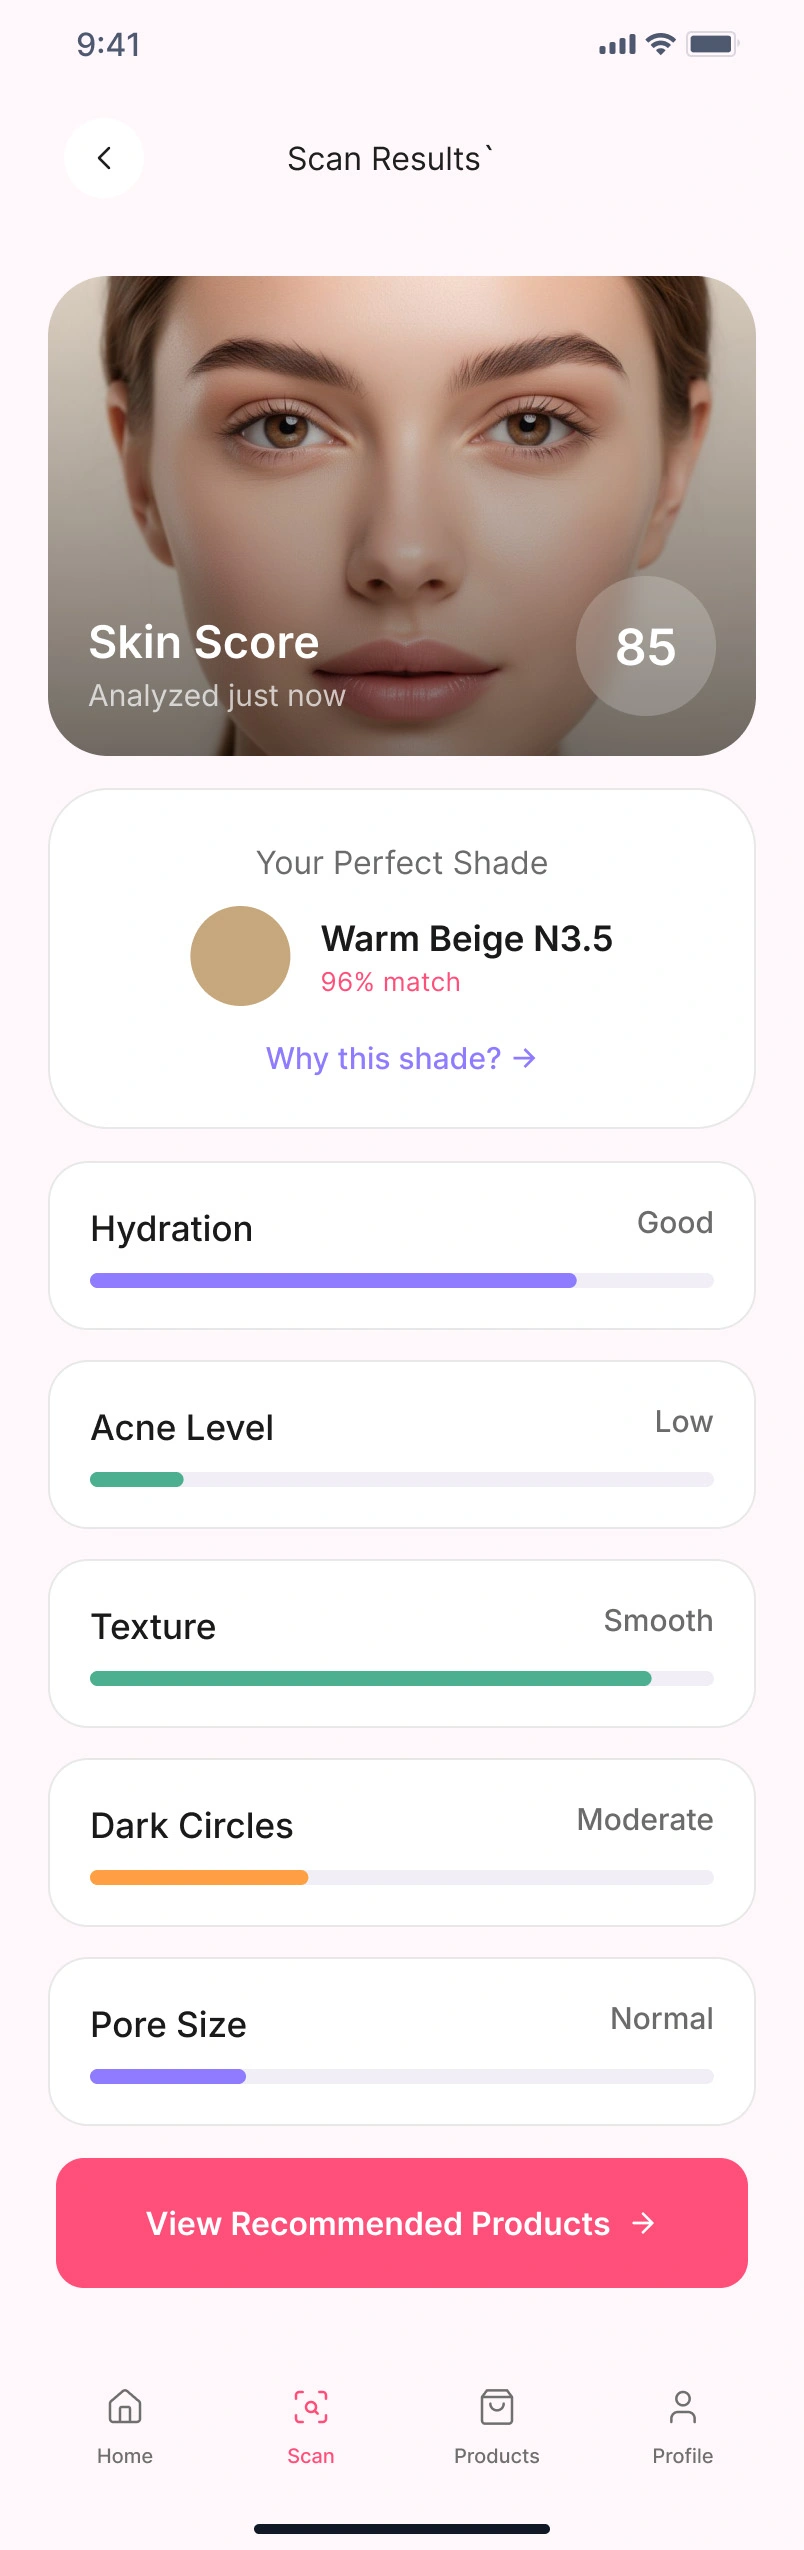
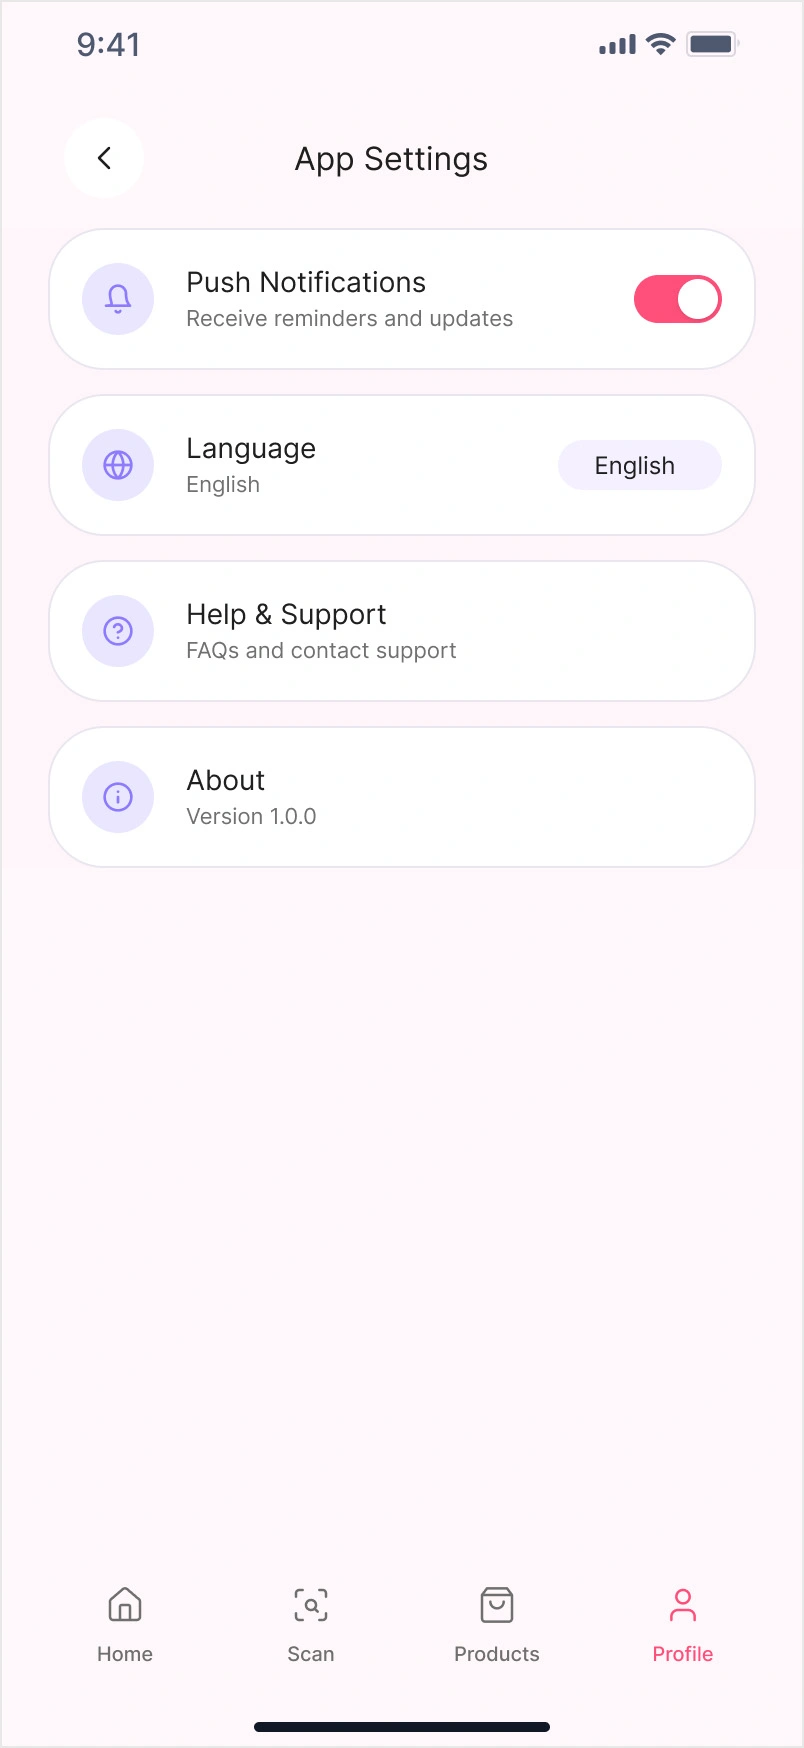
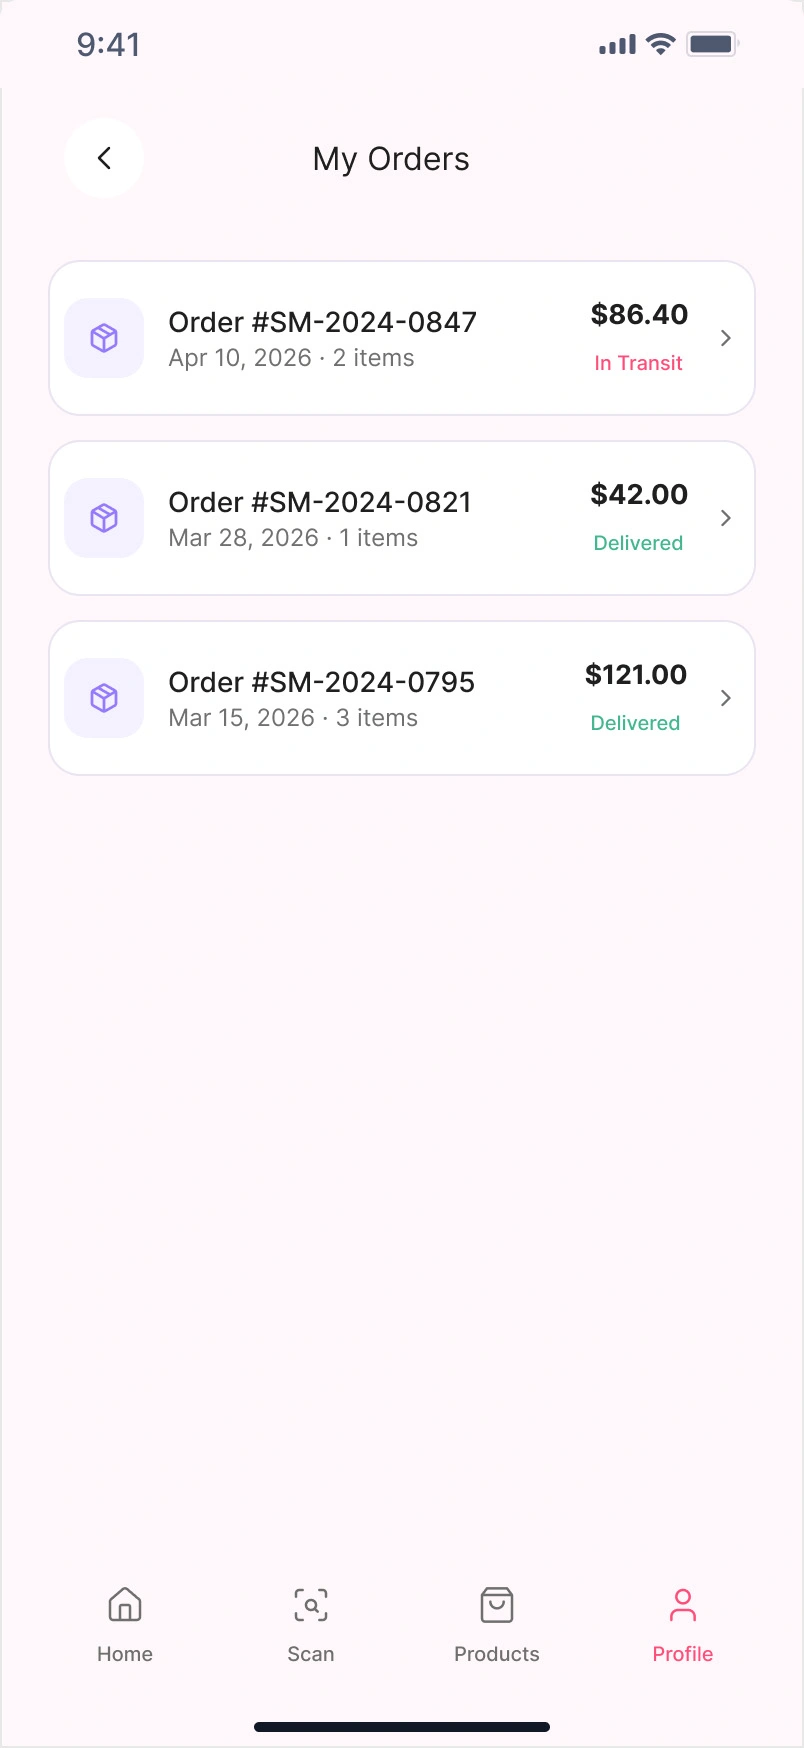
Reports & Insights
Detailed insights with actionable recommendations
Prototype
All Screens
Explore the Explore the dashboard interactions and data flow


PROJECT CONTEXT
This project was created as part of a product design assessment and is presented as a conceptual solution.
Final Thoughts
Designed to simplify data interpretation and support faster decision-making through intuitive analytics.